

Question: This Modules discussion question is MATLAB based. The data shown below is to be presented in a graphical format, using the graph of your choice.
This Modules discussion question is MATLAB based. The data shown below is to be presented in a graphical format, using the graph of your choice. In addition, justify why you selected this solution and any reasons why you rejected using any alternatives.
Assume this graph would be included in an academic journal paper. Include a title above and a legend positioned below and outside of the graphs area. Add a statement that exports the figure to .png file and saves it in the current folder.
Comment on two other postings, in particular solutions where alternatives to your graph were used.
Note: There are five sets of data and each has a sample of seven observations. All dimensions are in mm.
| 1 | 20.31 | 20.50 | 18.90 | 20.20 | 20.20 | 20.35 | 20.40 |
| 2 | 20.30 | 20.27 | 19.59 | 21.15 | 19.21 | 20.25 | 20.23 |
| 3 | 20.56 | 20.60 | 18.76 | 19.64 | 19.52 | 19.51 | 20.05 |
| 4 | 20.51 | 20.46 | 19.48 | 19.30 | 19.22 | 19.52 | 21.20 |
| 5 | 19.70 | 20.21 | 20.18 | 20.25 | 20.16 | 20.22 | 20.19 |
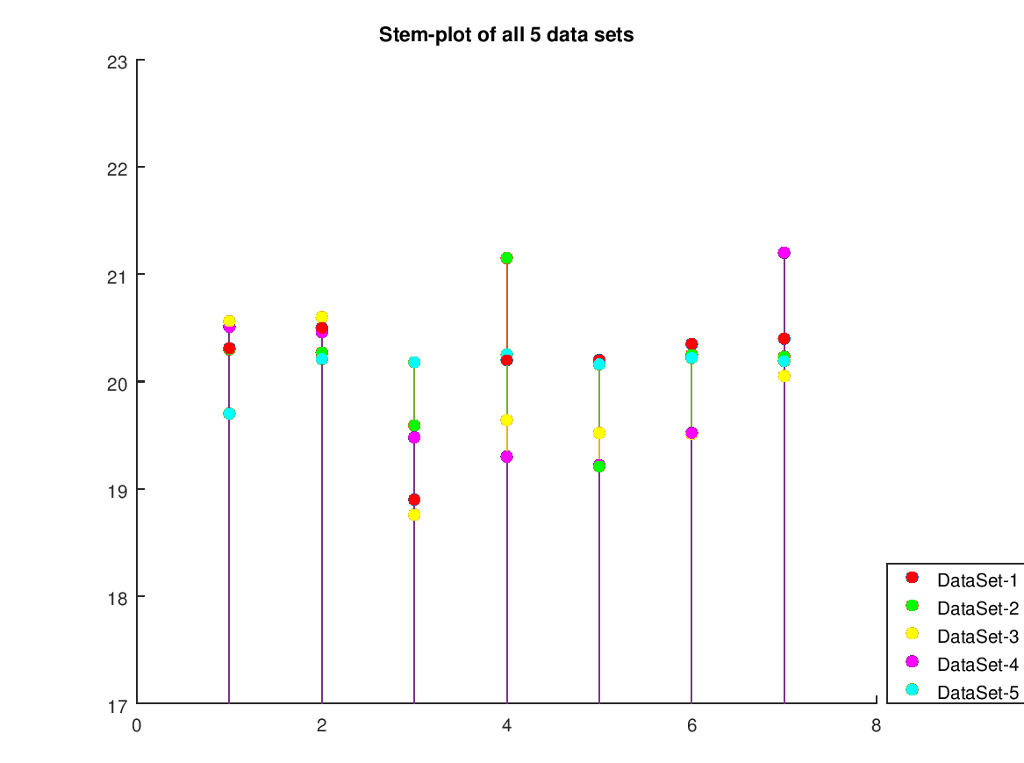
I chose stem - plot for the given data sets. Since the given data have only 1 dimension. So, choosing plots like a bar graph is not a good idea. Plots like stem-plot will plot the points very effectively. A stem-plot plots the points in the form of a circle which is connected by a line to x axis. The actual value is plotted on the Y-axis. The serial number is plotted on X-axis.
Two other alternatives which can be used here are - histogram, scatter plot. They also plot 1-D data effectively.
Matlab Code:
%Data Sets
X1 = [20.31, 20.50, 18.90, 20.20, 20.20, 20.35, 20.40]; X2 = [20.30, 20.27, 19.59, 21.15, 19.21, 20.25, 20.23]; X3 = [20.56, 20.60, 18.76, 19.64, 19.52, 19.51, 20.05]; X4 = [20.51, 20.46, 19.48, 19.30, 19.22, 19.52, 21.20]; X5 = [19.70, 20.21, 20.18, 20.25, 20.16, 20.22, 20.19];
%plot first stem-plot a = stem(X1, 'filled');
%hold on to same figure to plot next data set. hold on
%plot dataset-2 b = stem(X2, 'filled'); hold on
%plot dataset-3 c = stem(X3, 'filled'); hold on
%plot dataset-4 d = stem(X4, 'filled'); hold on
%plot dataset-5 e = stem(X5, 'filled');
%Set values for x and y axis. first two values for x axis limits and last two y axis limits. axis ([0 8 17 23])
%set different color for different data sets set(a,'MarkerFaceColor','r') set(b,'MarkerFaceColor','g') set(c,'MarkerFaceColor','y') set(d,'MarkerFaceColor','m') set(e,'MarkerFaceColor','c')
%set title title('Stem-plot of all 5 data sets')
%set legend legend({'DataSet-1 ','DataSet-2 ','DataSet-3 ','DataSet-4 ','DataSet-5 '},'Location','southeastoutside')
%hold off this figure hold off
%Save in png format with name stem-plot.jpg
saveas(gcf,'stem-plot.jpg')
ANSWER THIS (Be descriptive): What value does this graph provide in terms of graphical or visual effects?
Stem-plot of all 5 data sets 23 21 20 F 19 DataSet-1 DataSet-2 DataSet-3 DataSet-4 DataSet-5 18 17 2 4 6
Step by Step Solution
There are 3 Steps involved in it

Get step-by-step solutions from verified subject matter experts