

Question: This must be done using Matlab. 2. Distance between planets (15%) The orbits of Mercury and Earth can be (ideally) parameterized with respect to time
This must be done using Matlab.
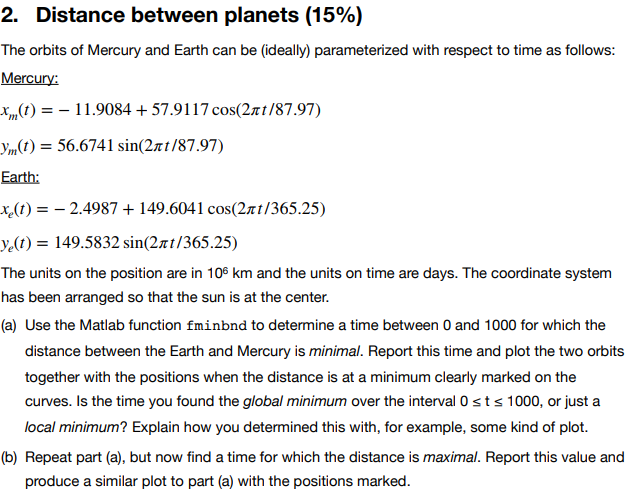
2. Distance between planets (15%) The orbits of Mercury and Earth can be (ideally) parameterized with respect to time as follows: Mercury: ,,(t)11.908457.9117 cos(2t /87.97) m(t)-56.6741 sin(2nt/87.97) Earth: (t) = _ 2.4987 + 149.6041 cos(2nt/365.25) e(t) 149.5832 sin(2nt/365.25) The units on the position are in 106 km and the units on time are days. The coordinate system has been arranged so that the sun is at the center. (a) Use the Matlab function fminbnd to determine a time between 0 and 1000 for which the distance between the Earth and Mercury is minimal. Report this time and plot the two orbits together with the positions when the distance is at a minimum clearly marked on the curves. Is the time you found the global minimum over the interval 0 sts 1000, or just a local minimum? Explain how you determined this with, for example, some kind of plot. (b) Repeat part (a), but now find a time for which the distance is maximal. Report this value and produce a similar plot to part (a) with the positions marked. 2. Distance between planets (15%) The orbits of Mercury and Earth can be (ideally) parameterized with respect to time as follows: Mercury: ,,(t)11.908457.9117 cos(2t /87.97) m(t)-56.6741 sin(2nt/87.97) Earth: (t) = _ 2.4987 + 149.6041 cos(2nt/365.25) e(t) 149.5832 sin(2nt/365.25) The units on the position are in 106 km and the units on time are days. The coordinate system has been arranged so that the sun is at the center. (a) Use the Matlab function fminbnd to determine a time between 0 and 1000 for which the distance between the Earth and Mercury is minimal. Report this time and plot the two orbits together with the positions when the distance is at a minimum clearly marked on the curves. Is the time you found the global minimum over the interval 0 sts 1000, or just a local minimum? Explain how you determined this with, for example, some kind of plot. (b) Repeat part (a), but now find a time for which the distance is maximal. Report this value and produce a similar plot to part (a) with the positions marked
Step by Step Solution
There are 3 Steps involved in it

Get step-by-step solutions from verified subject matter experts