

Question: This must be done using MATLAB. For this question, do not use polyfit function, but solve the normal equation with a backslash operator. Here are
This must be done using MATLAB.
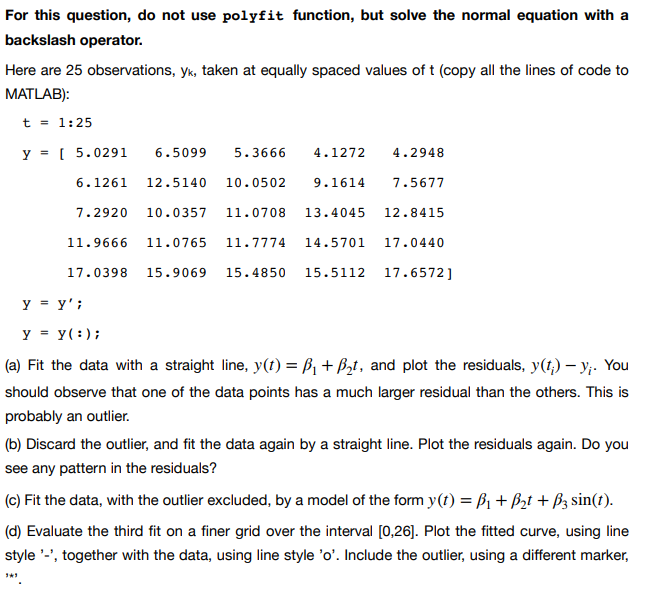
For this question, do not use polyfit function, but solve the normal equation with a backslash operator. Here are 25 observations, yx, taken at equally spaced values of t (copy all the lines of code to MATLAB): t1:25 y 5.0291 6.50995.3666 4.1272 4.2948 6.1261 12.5140 10.0502 9.16147.5677 7.2920 10.0357 11.0708 13.4045 12.8415 11.9666 11.0765 11.777414.5701 17.0440 17.039815.9069 15.4850 15.5112 17.6572 (a) Fit the data with a straight line, y(t) - Pi + B2t, and plot the residuals, y(i) - y,. You should observe that one of the data points has a much larger residual than the others. This is probably an outlier. (b) Discard the outlier, and fit the data again by a straight line. Plot the residuals again. Do you see any pattern in the residuals? (c) Fit the data, with the outlier excluded, by a model of the form y(t) -Pi +P2t + p3 sin(t) (d) Evaluate the third fit on a finer grid over the interval [0,26]. Plot the fitted curve, using line style '-', together with the data, using line style 'o'. Include the outlier, using a different marker
Step by Step Solution
There are 3 Steps involved in it

Get step-by-step solutions from verified subject matter experts