

Question: This needs to be answered in a excel graph Problem 4: begin{tabular}{|r|c|c|c|c|c|c|} hline & Net Sales & & & multicolumn{3}{|c|}{ Earnings } hline &
This needs to be answered in a excel graph
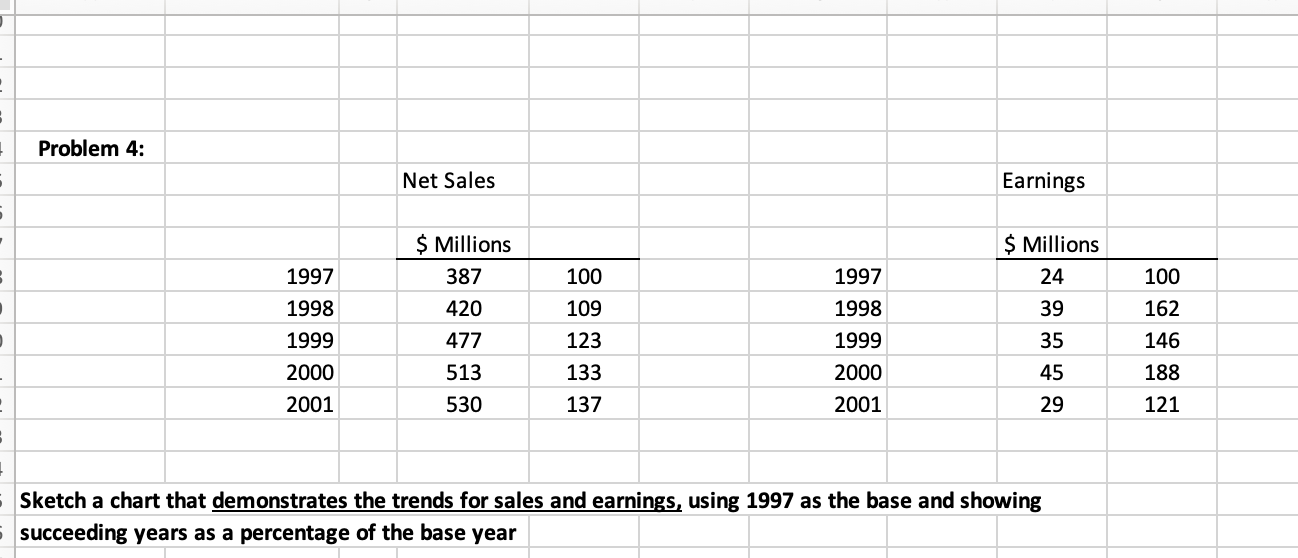
Problem 4: \begin{tabular}{|r|c|c|c|c|c|c|} \hline & Net Sales & & & \multicolumn{3}{|c|}{ Earnings } \\ \hline & & & & & & \\ \hline 1997 & \$ Millions & & & & \$ Millions & \\ \hline & 387 & 100 & & 24 & 100 \\ \hline 1998 & 420 & 109 & 1997 & 39 & 162 \\ \hline 1999 & 477 & 123 & 1998 & & 146 \\ \hline 2000 & 513 & 133 & 1999 & & 35 & 188 \\ \hline 2001 & 530 & 137 & 2000 & & 45 & 121 \\ \hline \end{tabular} Sketch a chart that demonstrates the trends for sales and earnings, using 1997 as the base and showing succeeding years as a percentage of the base year
Step by Step Solution
There are 3 Steps involved in it
1 Expert Approved Answer
Step: 1 Unlock

Question Has Been Solved by an Expert!
Get step-by-step solutions from verified subject matter experts
Step: 2 Unlock
Step: 3 Unlock