

Question: This pdf contains a table showing an annual Quality Cost Report. The costs are categorized by type of quality cost, they are totaled and those
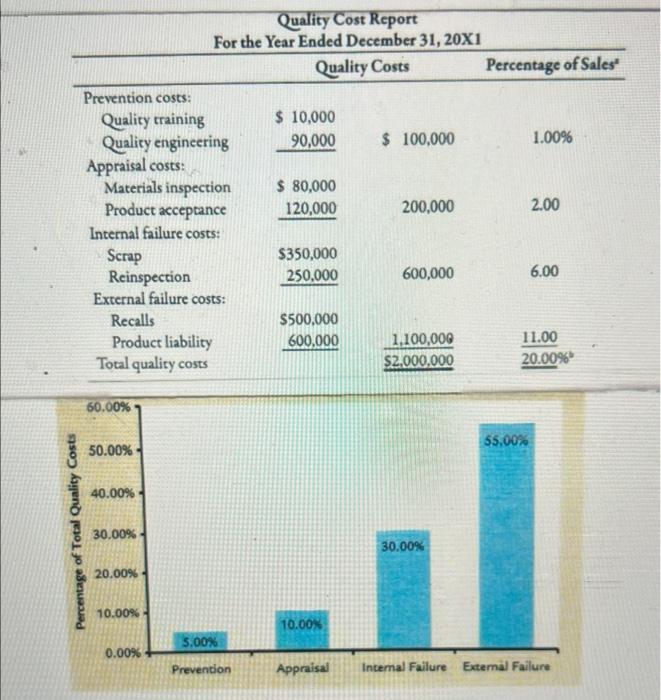
This pdf contains a table showing an annual Quality Cost Report. The costs are categorized by type of quality cost, they are totaled and those totals are identified as a percentage of the company sales.
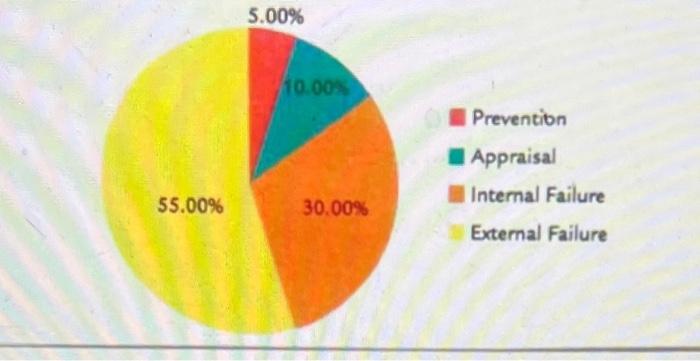
Below the table are two charts depicting the quality costs.
In one paragraph, tell me which graph you believe best represents this information and why.
9.9 points for a substantive reply with at least one reference to something you learned in chapter 9.
Step by Step Solution
There are 3 Steps involved in it
1 Expert Approved Answer
Step: 1 Unlock

Question Has Been Solved by an Expert!
Get step-by-step solutions from verified subject matter experts
Step: 2 Unlock
Step: 3 Unlock