

Question: this picture any better? The presentation should present a proposal for your kaizen leam as a champion (or project managor). For example, according to the
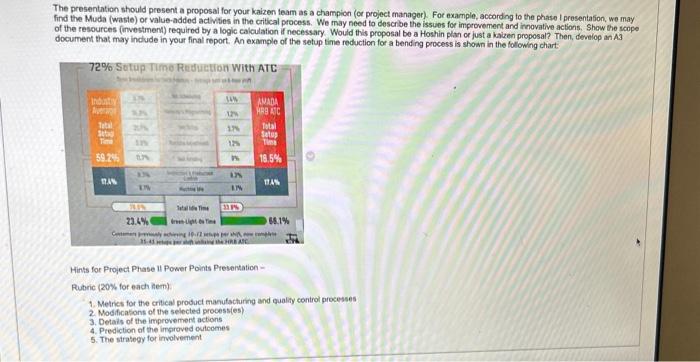
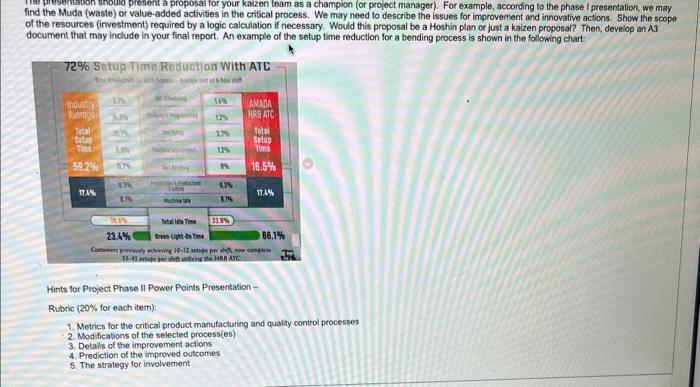
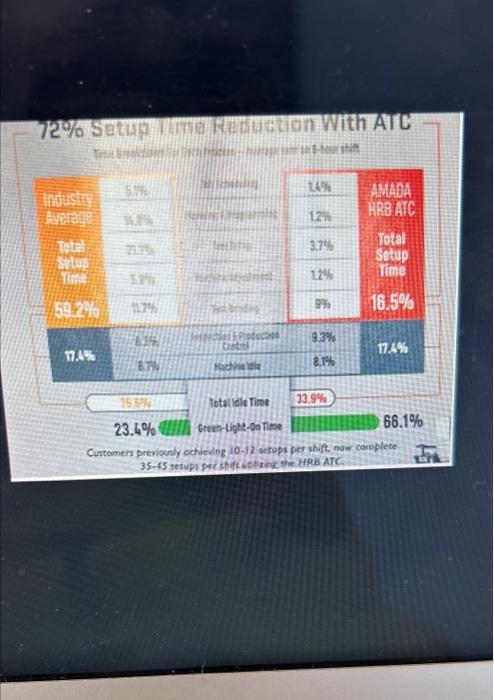
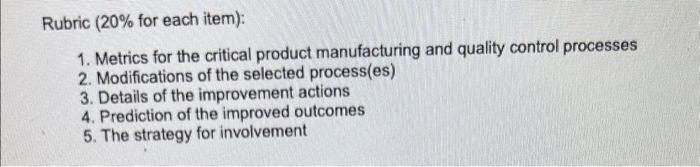
The presentation should present a proposal for your kaizen leam as a champion (or project managor). For example, according to the phase I presentafion, we may find the Muda (waste) or value-added activities in the critical process. We may need to describe the issuos for improvement and irnovative actions. Show the scope of the resources (investment) required by a loglc calculation if necessary Would thil proposal be a Hoshin plan or just a kaizen proposal? Then, develop an A3 document that may indude in your final report. An example of the setup time reduction for a bending process is shown in the following chart Hints for Project Phase 11 Power Points Presertation =- Pubric (20% for each hem). 1. Metrics for the critical product manutacturing and guality control processes 2. Modificatons of the selected process(es) 3. Detais of the improvement actions 4. Prediction af the imgreved outcomes 5. The strategy for involvement fartor your kaizen team as a champion (or project manager). For example, according to the phase I presentation, we may of the resoda (waste) or value-added activities in the critical process. We may need to describe the issues for improvement and innovative actions. Show the scope document that may include in your final report. An example of the setup time reduction for a bending process is shown in the following chart: Hints for Project Phase II Power Points Presentation - Rubric (20\% for each item): 1. Motrics for the critical product manufacturing and qualify control processes 2. Modifications of the selected process(es) 3. Detais of the improvement actions 4. Prediction of the improved outcomes 5. The strategy for involvement 35 - 45 setwps per shift iffininc the HRB-ATC. Rubric ( 20% for each item): 1. Metrics for the critical product manufacturing and quality control processes 2. Modifications of the selected process(es) 3. Details of the improvement actions 4. Prediction of the improved outcomes 5. The strategy for involvement The presentation should present a proposal for your kaizen leam as a champion (or project managor). For example, according to the phase I presentafion, we may find the Muda (waste) or value-added activities in the critical process. We may need to describe the issuos for improvement and irnovative actions. Show the scope of the resources (investment) required by a loglc calculation if necessary Would thil proposal be a Hoshin plan or just a kaizen proposal? Then, develop an A3 document that may indude in your final report. An example of the setup time reduction for a bending process is shown in the following chart Hints for Project Phase 11 Power Points Presertation =- Pubric (20% for each hem). 1. Metrics for the critical product manutacturing and guality control processes 2. Modificatons of the selected process(es) 3. Detais of the improvement actions 4. Prediction af the imgreved outcomes 5. The strategy for involvement fartor your kaizen team as a champion (or project manager). For example, according to the phase I presentation, we may of the resoda (waste) or value-added activities in the critical process. We may need to describe the issues for improvement and innovative actions. Show the scope document that may include in your final report. An example of the setup time reduction for a bending process is shown in the following chart: Hints for Project Phase II Power Points Presentation - Rubric (20\% for each item): 1. Motrics for the critical product manufacturing and qualify control processes 2. Modifications of the selected process(es) 3. Detais of the improvement actions 4. Prediction of the improved outcomes 5. The strategy for involvement 35 - 45 setwps per shift iffininc the HRB-ATC. Rubric ( 20% for each item): 1. Metrics for the critical product manufacturing and quality control processes 2. Modifications of the selected process(es) 3. Details of the improvement actions 4. Prediction of the improved outcomes 5. The strategy for involvement
Step by Step Solution
There are 3 Steps involved in it

Get step-by-step solutions from verified subject matter experts