

Question: This practice problem uses the data on the last page of this document. The data are the percent registered to vote and the percent who
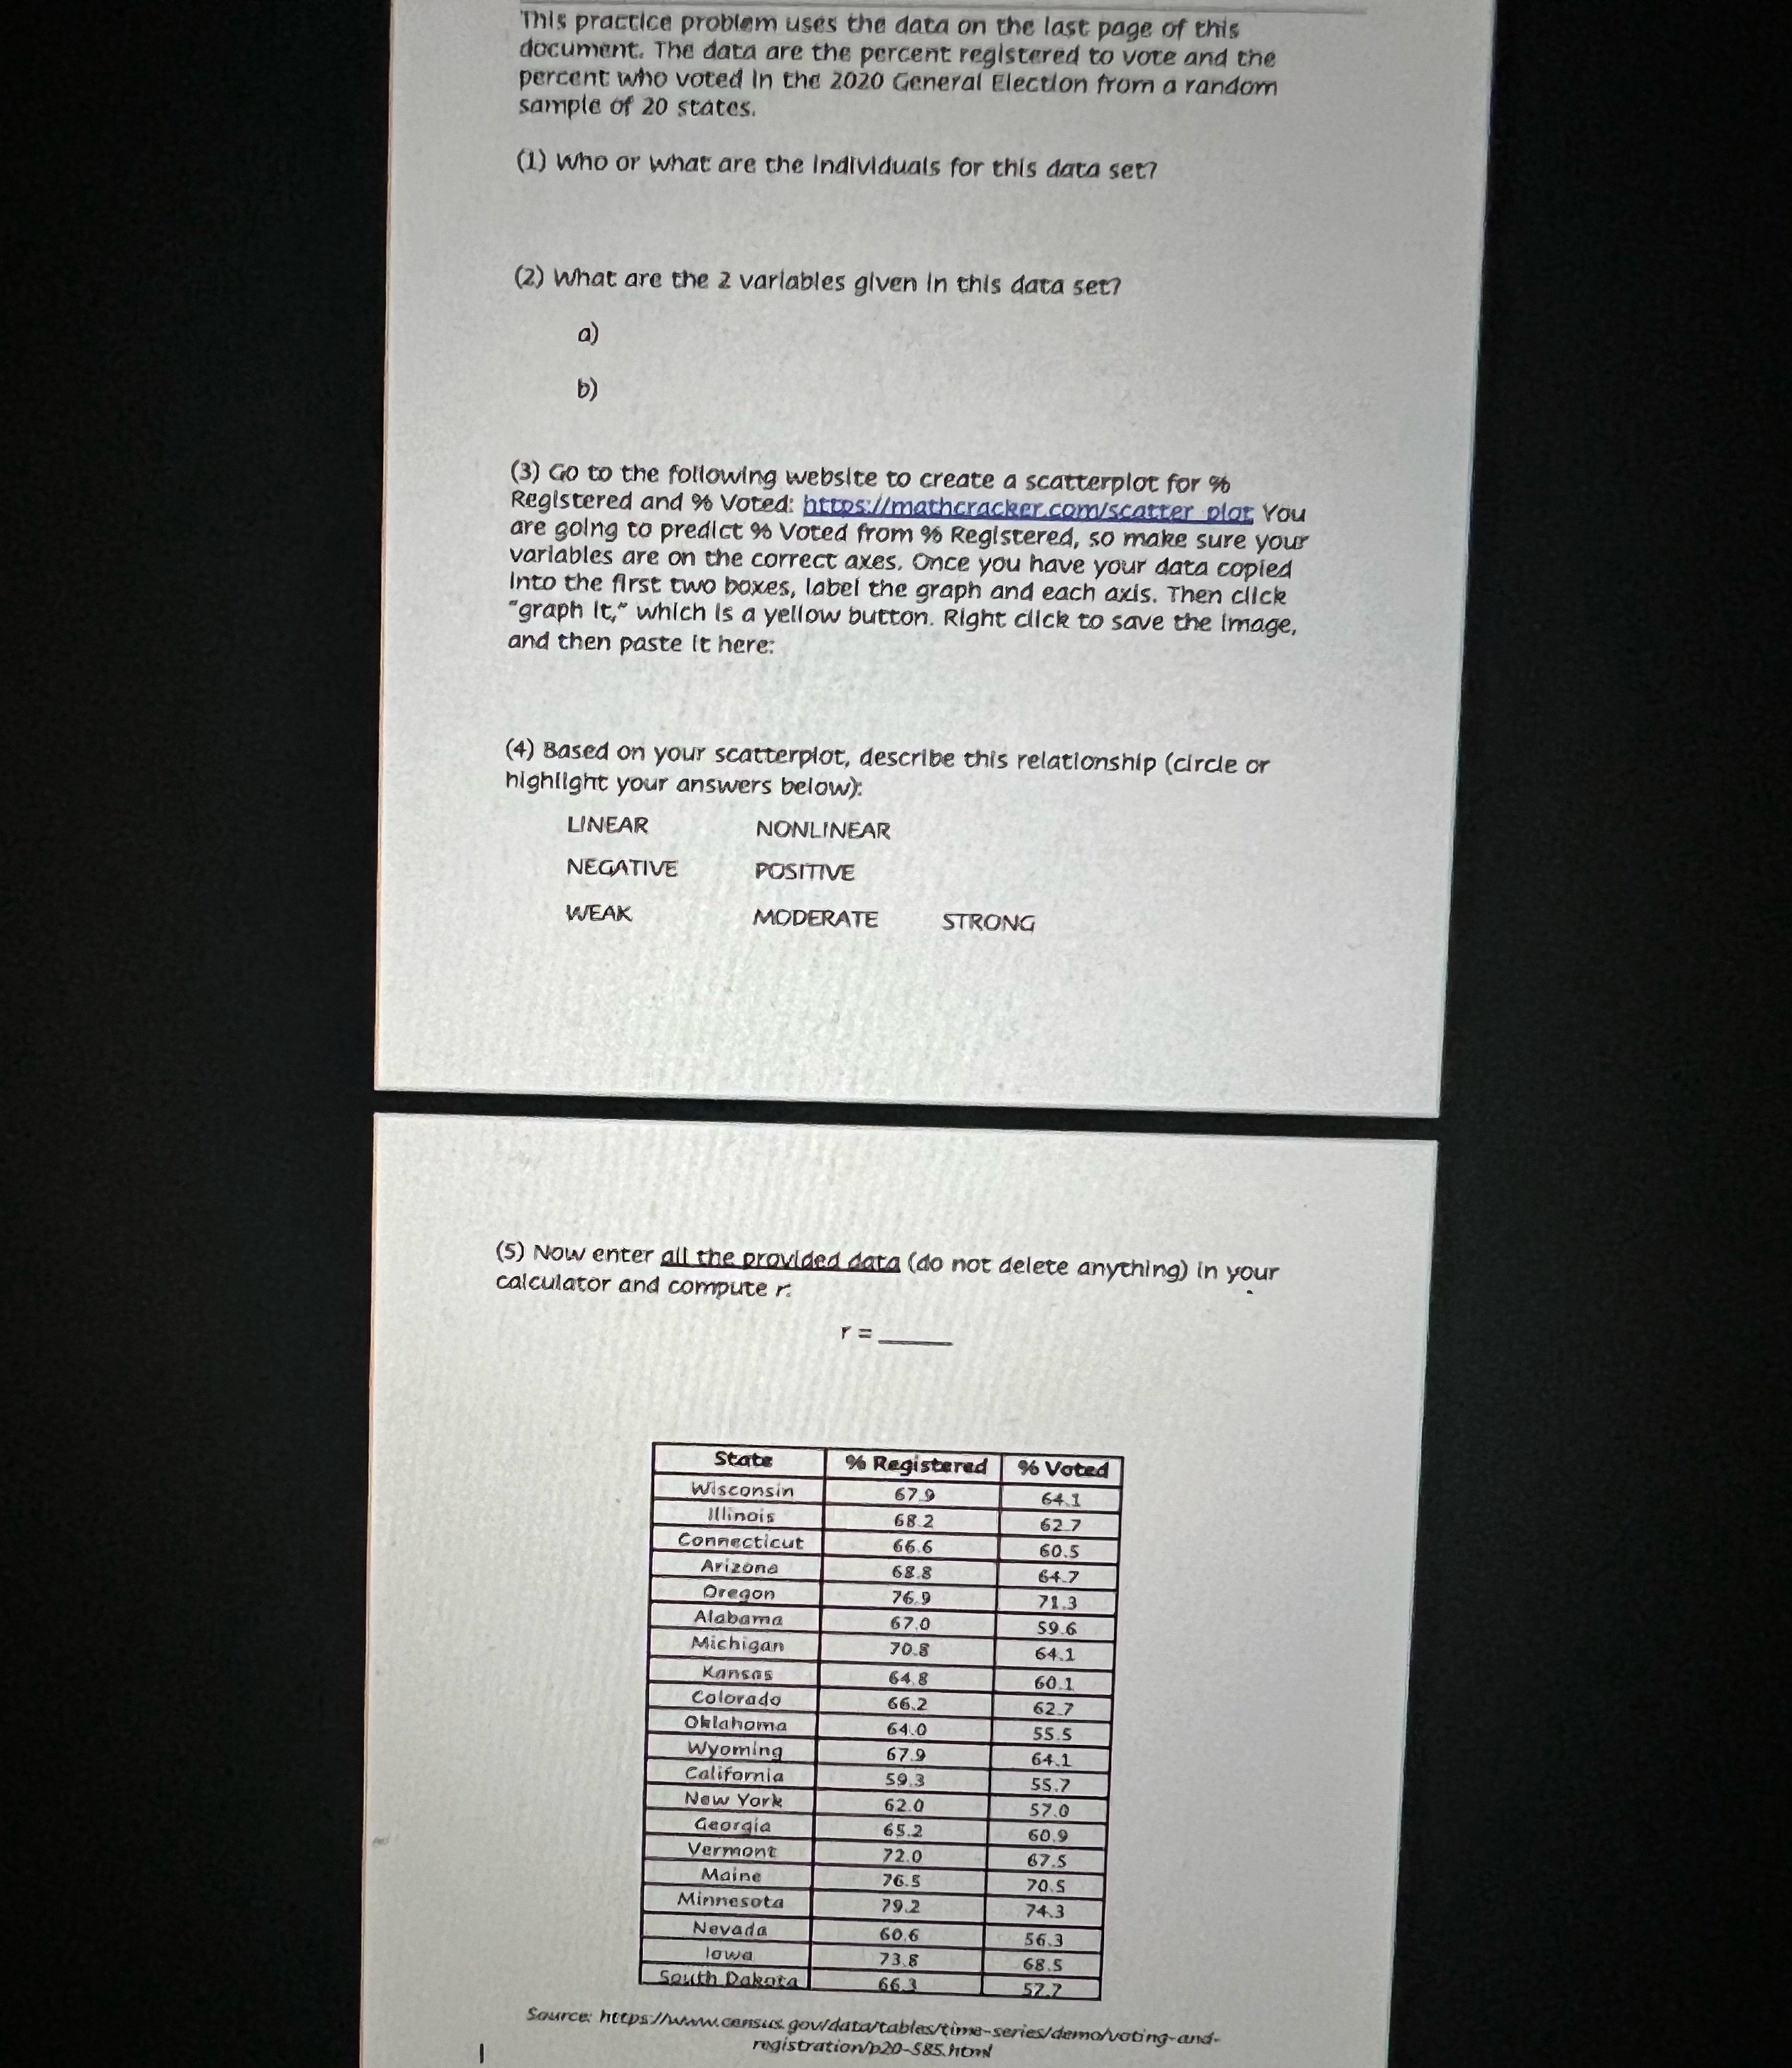
This practice problem uses the data on the last page of this document. The data are the percent registered to vote and the percent who voted in the 2020 General Election from a random sample of 20 states. (1) who or what are the Individuals for this data set? (2) what are the Z variables given in this data set? a) b ) (3) Go to the following website to create a scatterplot for % Registered and % Voted: https://mathcracker com/scatter plot You are going to predict 9% Voted from % Registered, so make sure your variables are on the correct axes, Once you have your data copied Into the first two boxes, label the graph and each axis. Then click "graph It," which is a yellow button. Right click to save the Image, and then paste it here: (4) Based on your scatterplot, describe this relationship (circle or highlight your answers below). LINEAR NONLINEAR NEGATIVE POSITIVE WEAK MODERATE STRONG (5) Now enter all the provided data (do not delete anything) in your calculator and computer. r = _ State % Registered| % Voted Wisconsin 641 Illinois 68 2 627 Connecticut 66.6 60.5 Arizona 68.8 647 Oregon 76.9 71.3 Alabama 67,0 59.6 Michigan 70.8 64.1 Kansas 64.8 601 Colorado 66.2 62.7 Oklahoma 64.0 55.5 Wyoming 67.9 64.1 California 59.3 55.7 New York 62.0 570 Georgia 65.2 60.9 Vermont 72.0 67.5 Maine 76.5 70.S Minnesota 79.2 74.3 Nevada 60.6 56.3 lowa 73.8 68.5 South Dakota 663 52.2 Source: https//www.cans.. gowdata/tables/time-series/demo/voting-and- registration 120-585. HON
Step by Step Solution
There are 3 Steps involved in it

Get step-by-step solutions from verified subject matter experts