

Question: This problem asks you to draw the histogram for the following GFDT of test scores Score 40 44 45 49 50 54 On the graph

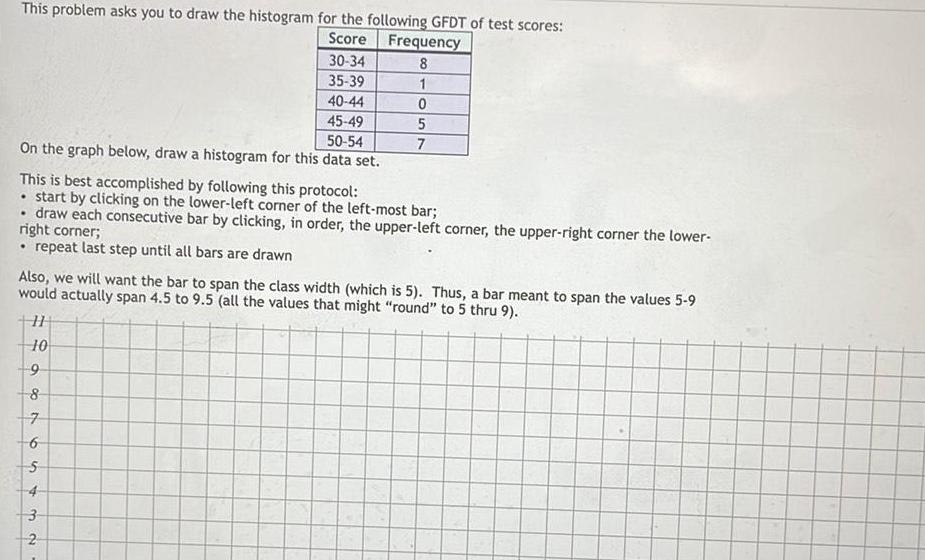
This problem asks you to draw the histogram for the following GFDT of test scores Score 40 44 45 49 50 54 On the graph below draw a histogram for this data set 30 34 35 39 This is best accomplished by following this protocol start by clicking on the lower left corner of the left most bar draw each consecutive bar by clicking in order the upper left corner the upper right corner the lower right corner repeat last step until all bars are drawn 5 Frequency 8 1 0 5 7 Also we will want the bar to span the class width which is 5 Thus a bar meant to span the values 5 9 would actually span 4 5 to 9 5 all the values that might round to 5 thru 9 H 10 9 8 7 6 4 3 2
Step by Step Solution
There are 3 Steps involved in it

Get step-by-step solutions from verified subject matter experts