

Question: This problem considers production and comparative advantage. See the table below. Pennsylvania Maryland Bushels of Soybeans 23 per acre 15 per acre Bushels of Wheat
This problem considers production and comparative advantage. See the table below.
Pennsylvania | Maryland | |
Bushels of Soybeans | 23 per acre | 15 per acre |
Bushels of Wheat | 8 per acre | 10 per acre |
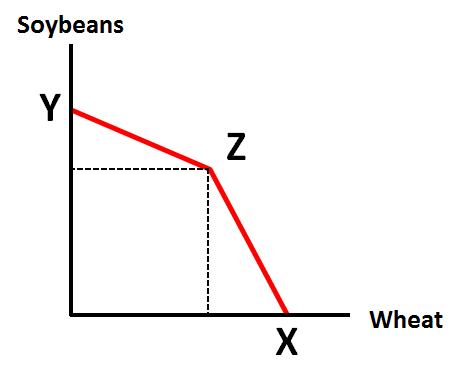
Assume each state has 100 acres of farmland to use. Use the table above to label the graph below. The graph below is an illustration of the combined daily PPF for Pennsylvania and Maryland. Note that to numerically label the graph correctly, you must first find the correct opportunity costs and comparative advantages in production, even though you are not asked to show that work here.
Step by Step Solution
There are 3 Steps involved in it
1 Expert Approved Answer
Step: 1 Unlock

Question Has Been Solved by an Expert!
Get step-by-step solutions from verified subject matter experts
Step: 2 Unlock
Step: 3 Unlock