

Question: This problem is based on information taken from The Merck Manual (a reference manual used in most medical and nursing schools). Hypertension is defined as
- This problem is based on information taken from The Merck Manual (a reference manual used in most medical and nursing schools). Hypertension is defined as a blood pressure reading over 140 mm Hg systolic and/or over 90 mm Hg diastolic. Hypertension, if not corrected, can cause long-term health problems. In the college-age population (18-24 years), about 9.2% have hypertension. Suppose that a blood donor program is taking place in a college dormitory this week (final exams week). Before each student gives blood, the nurse takes a blood pressure reading. Of 194 donors, it is found that 28 have hypertension. Do these data indicate that the population proportion of students with hypertension during final exams week is higher than 9.2%? Use a 5% level of significance.
(a) What is the level of significance?
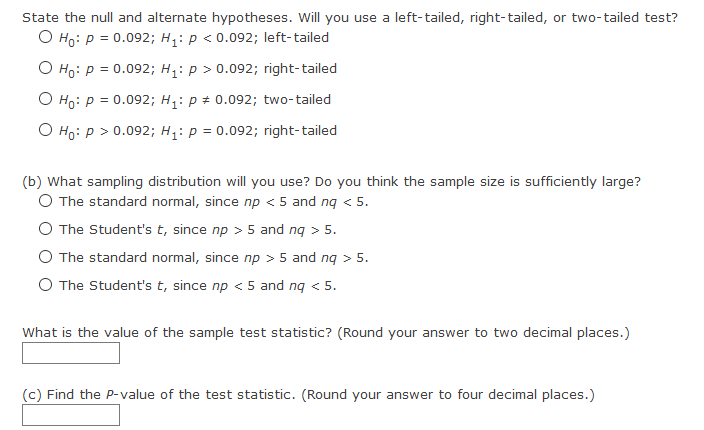
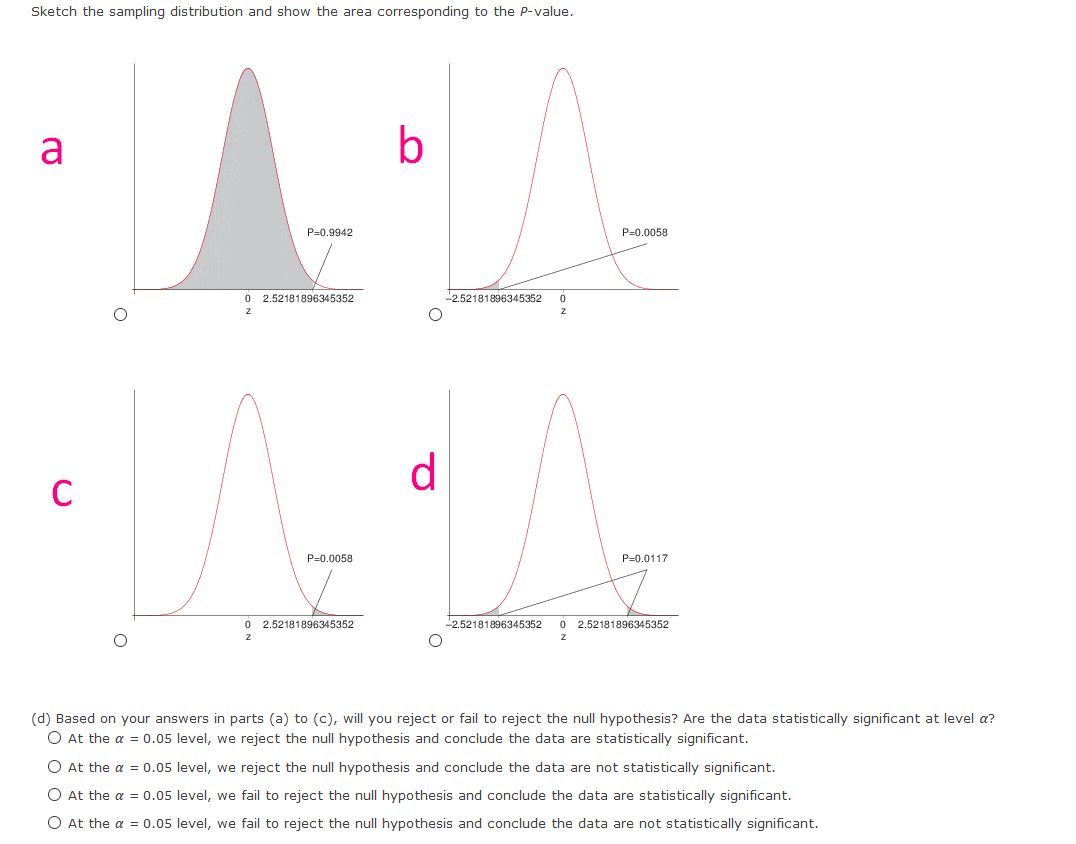
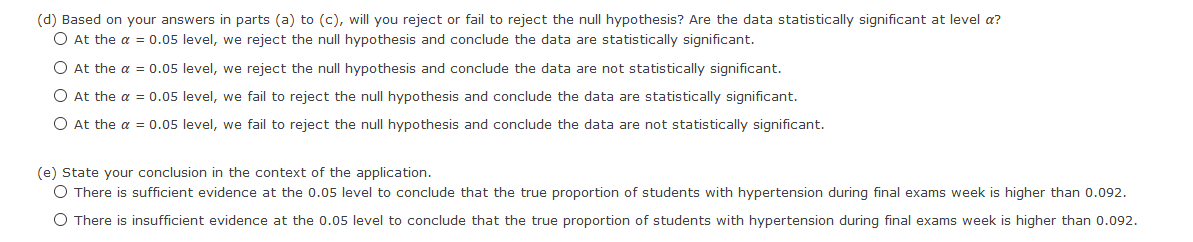
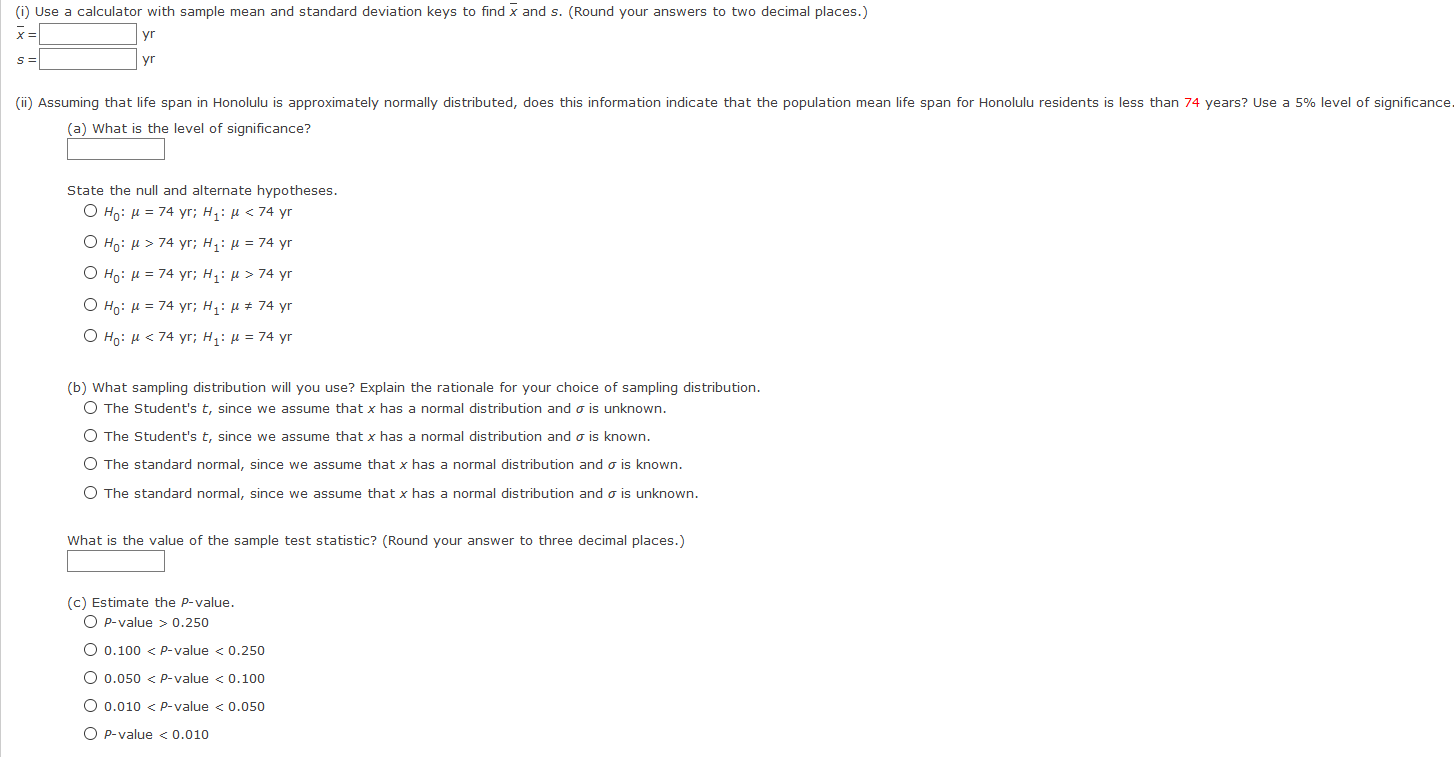
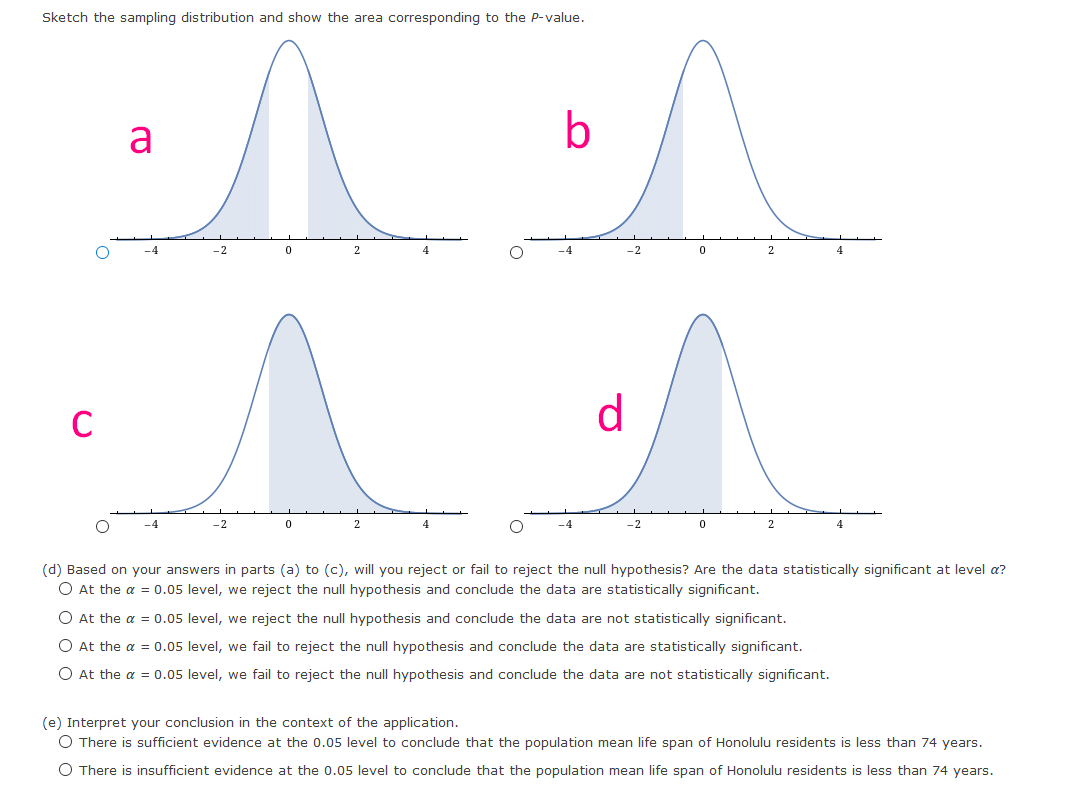
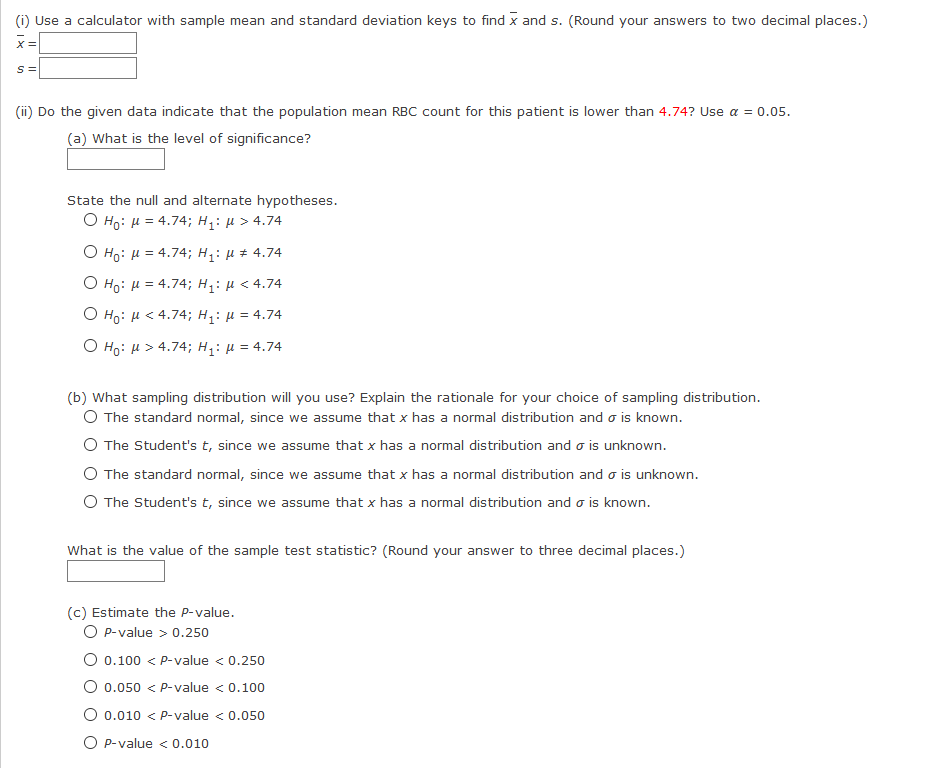
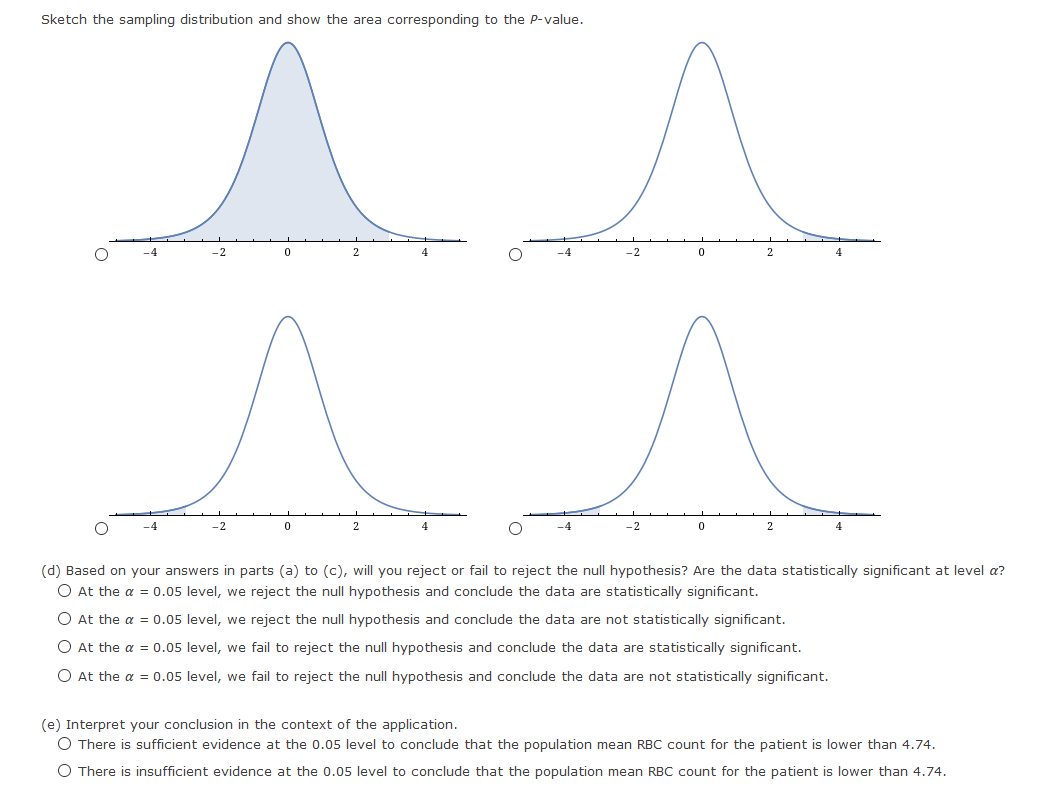
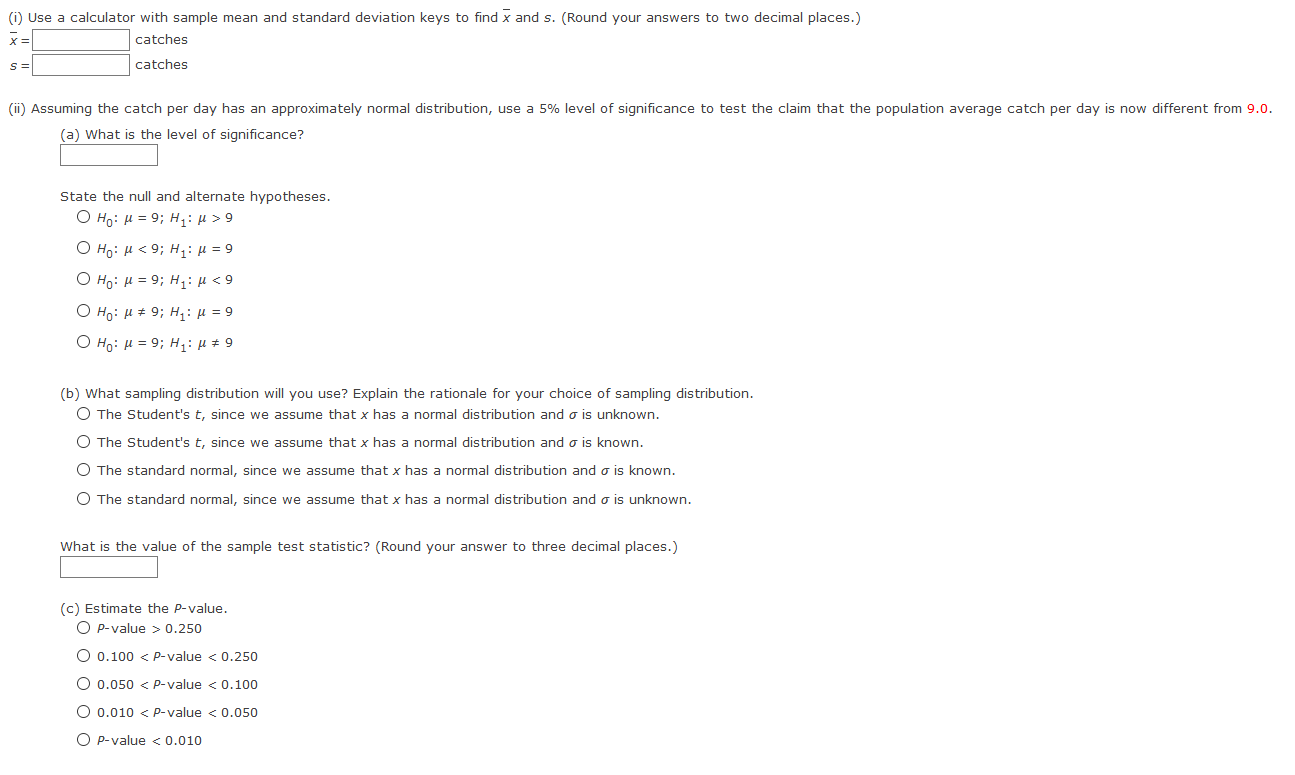
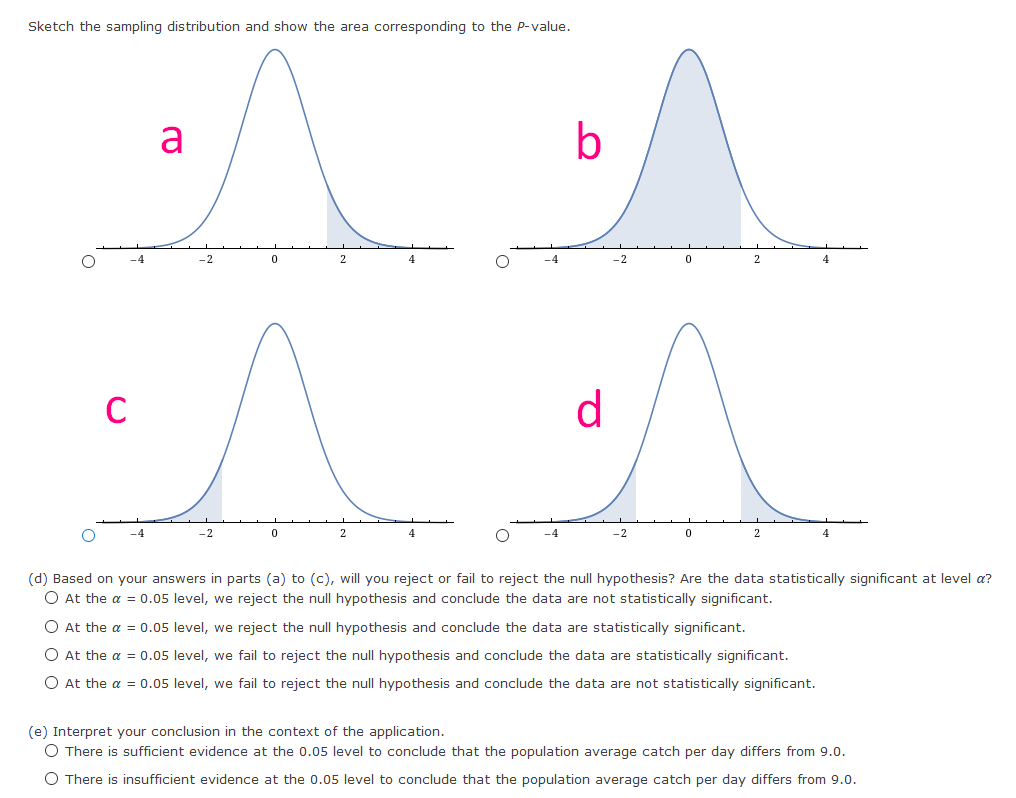
State the null and alternate hypotheses. Will you use a left-tailed, right-tailed, or two-tailed test? 0 H0: p = o.o92; H1: p a: o.o92; left-tailed 0 Ha: p = o.o92; H1: p :: o.o92; right-tailed C} HG: p = o.o92; H1: p : o.o92; two-tailed 0 H0: p := o.o92; H1: ,0 = o.o92; right-tailed {lo} What sampling distribution will you use? Do you think the sample size is sufciently large? 0 The standard normal, since Hp a: 5 and nor a: 5. D The Student's t, since Hp :- 5 and no :- 5. C} The standard normal, since Hp := 5 and nor :=~ 5. D The Student's t, since Hp :: 5 and no a: 5. What is the value of the sample test statistic? {Round your answer to two decimal places.) E {c} Find the P-yalue of the test statistic. {Round your answer to four decimal places.) E Sketch the sampling distribution and show the area corresponding to the P-value. a b P=0.9942 P=0.0058 2.52181896345352 -2.52181896345352 NO O O Q C P=0.0058 P=0.0117 2.52181896345352 -2.52181896345352 0 2.52181896345352 O O (d) Based on your answers in parts (a) to (c), will you reject or fail to reject the null hypothesis? Are the data statistically significant at level a? O At the a = 0.05 level, we reject the null hypothesis and conclude the data are statistically significant At the a = 0.05 level, we reject the null hypothesis and conclude the data are not statistically significant. O At the a = 0.05 level, we fail to reject the null hypothesis and conclude the data are statistically significant. O At the a = 0.05 level, we fail to reject the null hypothesis and conclude the data are not statistically significant.(d) Based on your answers in parts (a) to (c), will you reject or fail to reject the null hypothesis? Are the data statistically significant at level a? At the a = 0.05 level, we reject the null hypothesis and conclude the data are statistically significant. O At the a = 0.05 level, we reject the null hypothesis and conclude the data are not statistically significant. O At the a = 0.05 level, we fail to reject the null hypothesis and conclude the data are statistically significant. O At the a = 0.05 level, we fail to reject the null hypothesis and conclude the data are not statistically significant. (e) State your conclusion in the context of the application. O There is sufficient evidence at the 0.05 level to conclude that the true proportion of students with hypertension during final exams week is higher than 0.092. O There is insufficient evidence at the 0.05 level to conclude that the true proportion of students with hypertension during final exams week is higher than 0.092.(i) Use a calculator with sample mean and standard deviation keys to find x and s. (Round your answers to two decimal places.) X = yr S = yr (ii) Assuming that life span in Honolulu is approximately normally distributed, does this information indicate that the population mean life span for Honolulu residents is less than 74 years? Use a 5% level of significance (a) What is the level of significance? State the null and alternate hypotheses. O Ho: H = 74 yr; H1: H 74 yr; H1: 1 = 74 yr O Ho: H = 74 yr; H1: M > 74 yr O Ho: M = 74 yr; H1: M # 74 yr O Ho: M 0.250 O 0.100 4.74 O Ho: H = 4.74; H1: H # 4.74 O Ho: H = 4.74; H1: M 4.74; H 1: H = 4.74 (b) What sampling distribution will you use? Explain the rationale for your choice of sampling distribution. O The standard normal, since we assume that x has a normal distribution and o is known. The Student's t, since we assume that x has a normal distribution and o is unknown. The standard normal, since we assume that x has a normal distribution and o is unknown. O The Student's t, since we assume that x has a normal distribution and o is known. What is the value of the sample test statistic? (Round your answer to three decimal places.) (c) Estimate the P-value. O P-value > 0.250 O 0.100 9 O Ho: H 0.250 0.100
Step by Step Solution
There are 3 Steps involved in it

Get step-by-step solutions from verified subject matter experts