Question: This problem is for a finance class and I am having difficulty with trying to complete the spreadsheet as the calculations in the spreadsheet will
This problem is for a finance class and I am having difficulty with trying to complete the spreadsheet as the calculations in the spreadsheet will generate the answers for the empty fields. The attached images are what I am working on and I am stuck on the entire problem. I've tried to answer these questions but the calculations I'm coming up with aren't correct. This is very confusing! Please help!!
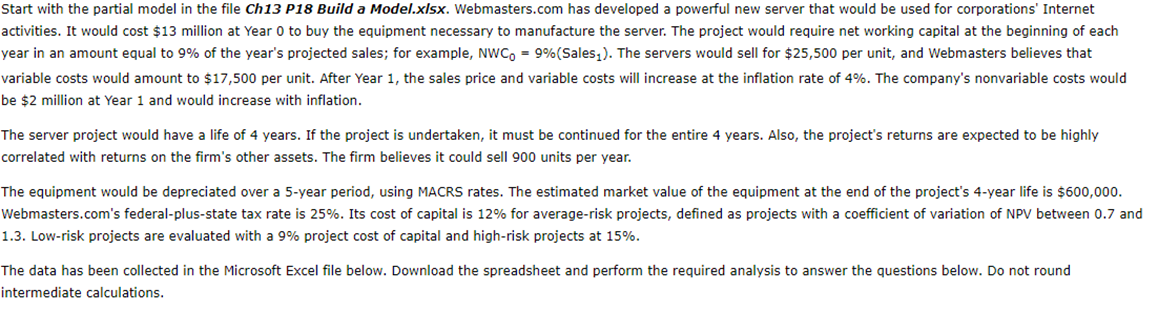
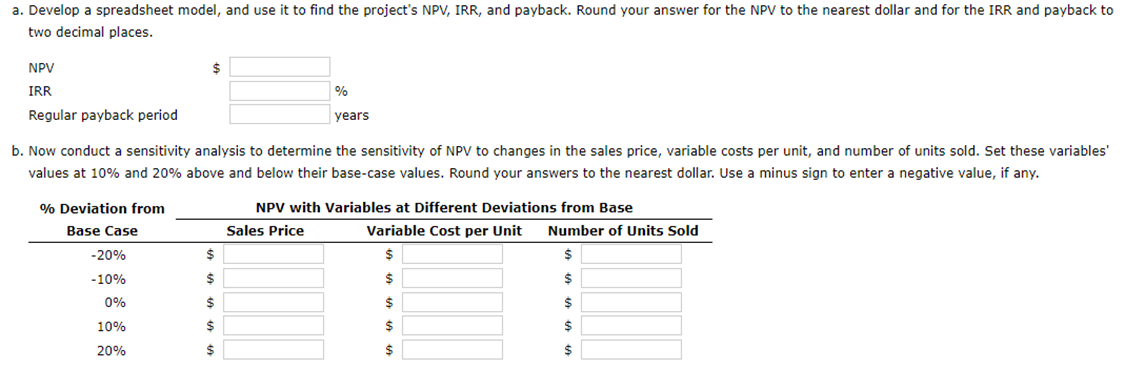
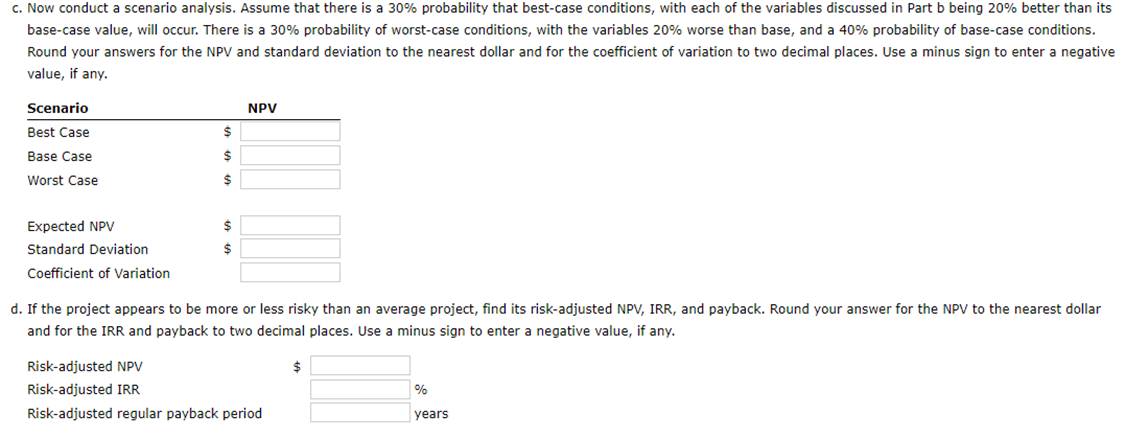
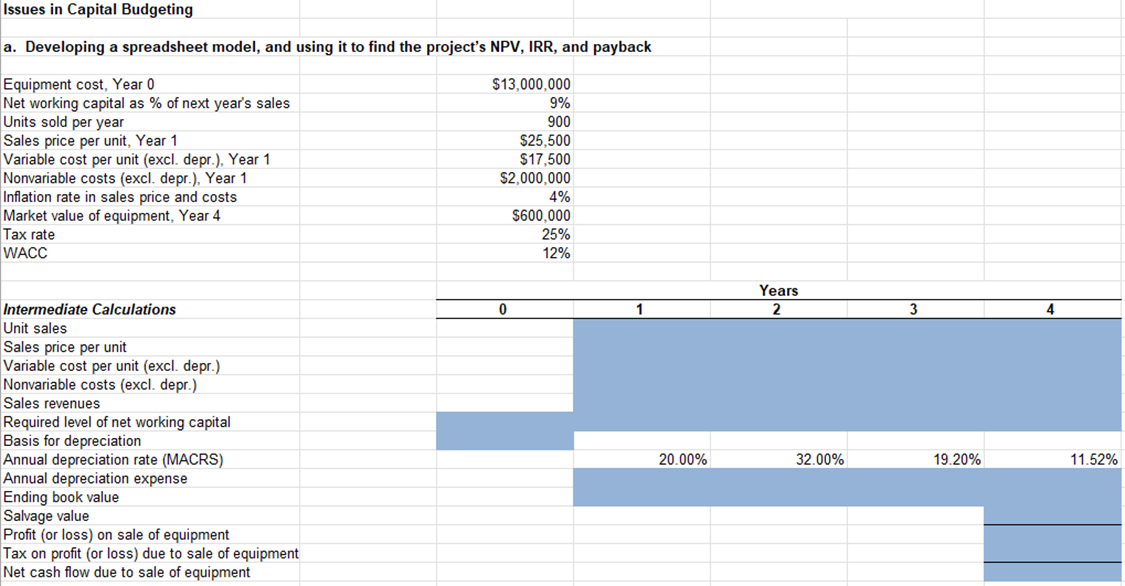
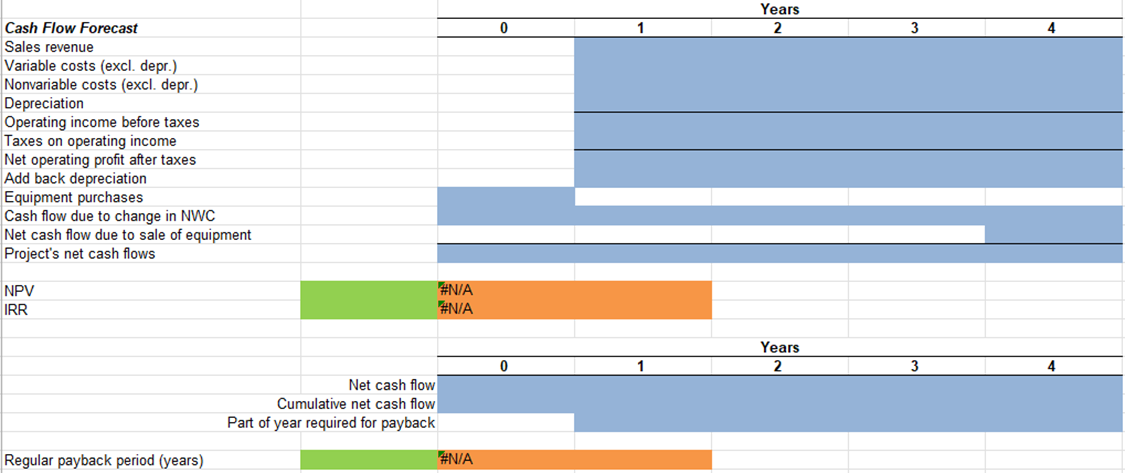
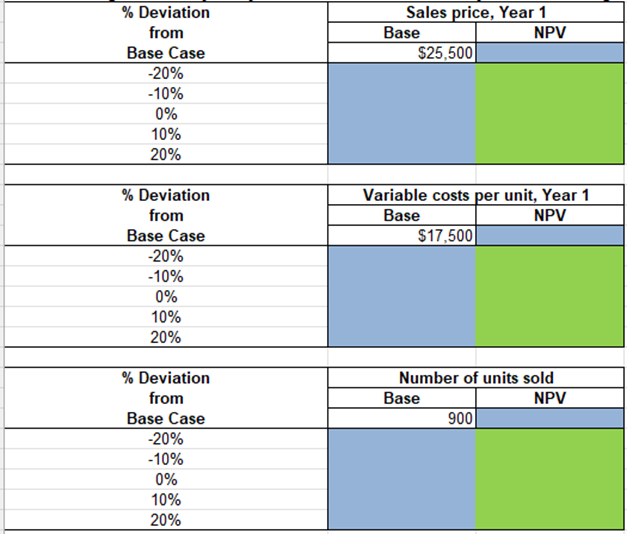
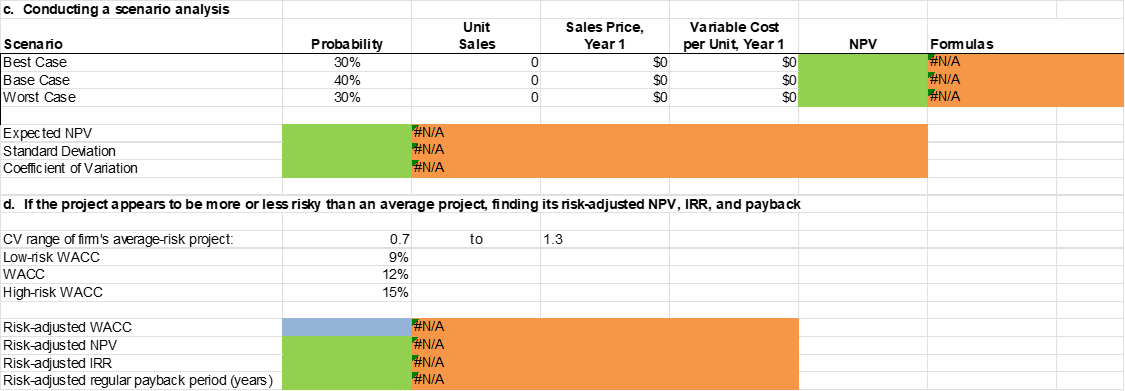
Start with the partial model in the file Ch13 P18 Build a Model.x/sx. Webmasters.com has developed a powerful new server that would be used for corporations' Internet activities. It would cost $13 million at Year 0 to buy the equipment necessary to manufacture the server. The project would require net working capital at the beginning of each year in an amount equal to 9% of the year's projected sales; for example, NWCo = 9%(Sales,). The servers would sell for $25,500 per unit, and Webmasters believes that variable costs would amount to $17,500 per unit. After Year 1, the sales price and variable costs will increase at the inflation rate of 4%. The company's nonvariable costs would be $2 million at Year 1 and would increase with inflation. The server project would have a life of 4 years. If the project is undertaken, it must be continued for the entire 4 years. Also, the project's returns are expected to be highly correlated with returns on the firm's other assets. The firm believes it could sell 900 units per year. The equipment would be depreciated over a 5-year period, using MACRS rates. The estimated market value of the equipment at the end of the project's 4-year life is $600,000. Webmasters.com's federal-plus-state tax rate is 25%. Its cost of capital is 12% for average-risk projects, defined as projects with a coefficient of variation of NPV between 0.7 and 1.3. Low-risk projects are evaluated with a 9% project cost of capital and high-risk projects at 15%. The data has been collected in the Microsoft Excel file below. Download the spreadsheet and perform the required analysis to answer the questions below. Do not round intermediate calculations.a. Develop a spreadsheet model, and use it to find the project's NPV, IRR, and payback. Round your answer for the NPV to the nearest dollar and for the IRR and payback to two decimal places. NPV IRR Regular payback period years b. Now conduct a sensitivity analysis to determine the sensitivity of NPV to changes in the sales price, variable costs per unit, and number of units sold. Set these variables' values at 10% and 20% above and below their base-case values. Round your answers to the nearest dollar. Use a minus sign to enter a negative value, if any. % Deviation from NPV with Variables at Different Deviations from Base Base Case Sales Price Variable Cost per Unit Number of Units Sold -20% -10% 0% 10% 20% $ $c. Now conduct a scenario analysis. Assume that there is a 30% probability that best-case conditions, with each of the variables discussed in Part b being 20% better than its base-case value, will occur. There is a 30% probability of worst-case conditions, with the variables 20% worse than base, and a 40% probability of base-case conditions. Round your answers for the NPV and standard deviation to the nearest dollar and for the coefficient of variation to two decimal places. Use a minus sign to enter a negative value, if any. Scenario NPV Best Case in Base Case Worst Case $ Expected NPV Standard Deviation Coefficient of Variation d. If the project appears to be more or less risky than an average project, find its risk-adjusted NPV, IRR, and payback. Round your answer for the NPV to the nearest dollar and for the IRR and payback to two decimal places. Use a minus sign to enter a negative value, if any. Risk-adjusted NPV $ Risk-adjusted IRR % Risk-adjusted regular payback period yearsIssues In Capital Budgeting :1. Developing a spreadsheet model, and using it to nd the project's NPV. IRR, and payback Equipment cost. Year 0 313000000 Net working capital as '96 of next year's sales 9% Units sold per year 900 Sales pn'ce per unit, Year 1 $25,500 Variable cost per unit (excl. dept}. Year 1 317.500 Nomanable costs (excl. dept}. Year 1 52.000000 Ination rate in sales price and costs 4% Market value of equipment, Year 4 $500,000 Tax rate 25% WACC 12% Mediate Calculations Unit sales Sales piice per unit Variable cost per unit (excl. depr.) Nomariable costs (excl. depr.} Sales revenues Required level of net working capital Basis for depreciation Annual depreciation rate (MACRS) Annual depreciation expense Ending book value Salvage value Prot (or loss} on sale of emiipment Tax on prot {or loss) due to sale of equipment Net cash ow due to sale of equipment Years Cash Flow Forecast 0 1 2 4 Sales revenue Variable costs (excl. depr.) Nonvariable costs (excl. depr.) Depreciation Operating income before taxes Taxes on operating income Net operating profit after taxes Add back depreciation Equipment purchases Cash flow due to change in NWC Net cash flow due to sale of equipment Project's net cash flows NPV #N/A IRR #N/A Years 0 1 2 Net cash flow Cumulative net cash flow Part of year required for payback Regular payback period (years) #N/Ab. Conducting a sensitivity analysistn determine the sensitivity of NPV to changes in the sales price, variable costs per unit and number of units sold % Deviation Sales price, Year 1 from Base NPV Base Case $25,500 20% -10% 0% 10% 20% % Deviation Variable costs per unit, Year 1 from Base NPV Base Case $17,500 -20% -10% 0% 10% 20% % Deviation Number of units sold from Base NPV Base Case 900 -20% -10% 0% 10% 20%Constructing the project's sensitivity graph % Deviation NPV with Variables at Different Deviations from Base from . Variable Cost per Number of Units Base Case sa'es Pnce Unit Sold -20% $0 $0 $0 40% $0 $0 $0 0% $0 $0 $0 10% $0 $0 $0 20% $0 $0 $0 \f
Step by Step Solution
There are 3 Steps involved in it
1 Expert Approved Answer
Step: 1 Unlock
Question Has Been Solved by an Expert!
Get step-by-step solutions from verified subject matter experts
Step: 2 Unlock
Step: 3 Unlock
Students Have Also Explored These Related Accounting Questions!