

Question: This problem must be answered using MatLab: 5. (25 points) A Gaussian function centered at the point ro is defined as f(r)e (r-ro) Use a
This problem must be answered using MatLab:
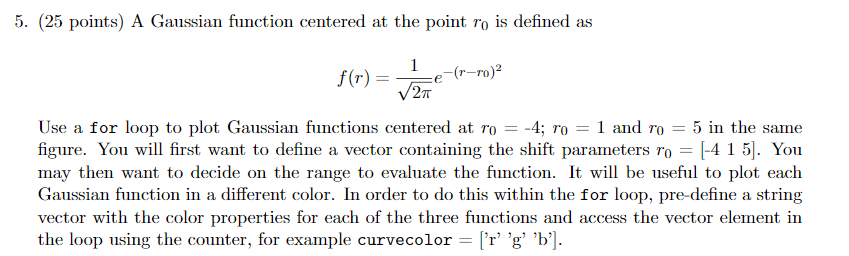
5. (25 points) A Gaussian function centered at the point ro is defined as f(r)e (r-ro) Use a for loop to plot Gaussian functions centered at r =-4; ro = 1 and ro = 5 in the same figure. You will first want to define a vector containing the shift parameters ro 415. You may then want to decide on the range to evaluate the function. It wl be useful to plot each Gaussian function in a different color. In order to do this within the for loop, pre-define a string vector with the color properties for each of the three functions and access the vector element in the loop using the counter, for example curvecolor - 'r 'g' 'b
Step by Step Solution
There are 3 Steps involved in it

Get step-by-step solutions from verified subject matter experts