

Question: This problem uses the information from Problem 9-4 about Canton Corporation to estimate the firms enterprise value using the APV model. a. What is the
This problem uses the information from Problem 9-4 about Canton Corporation to estimate the firm’s enterprise value using the APV model.
a. What is the firm’s unlevered cost of equity? (Hint: The firm’s debt beta is .20)
b. What are the unlevered FCFs for Canton for years 1 through 4? (Hint: The unlevered FCFs are the same as the firm FCFs.)
c. What are the interest tax savings for Canton for years 1 through 4?
d. Based on your estimate of enterprise value, what is the value per share of equity for the firm if the firm has 2 million shares outstanding? Remember that your calculations up to this point have been in thousands of dollars.
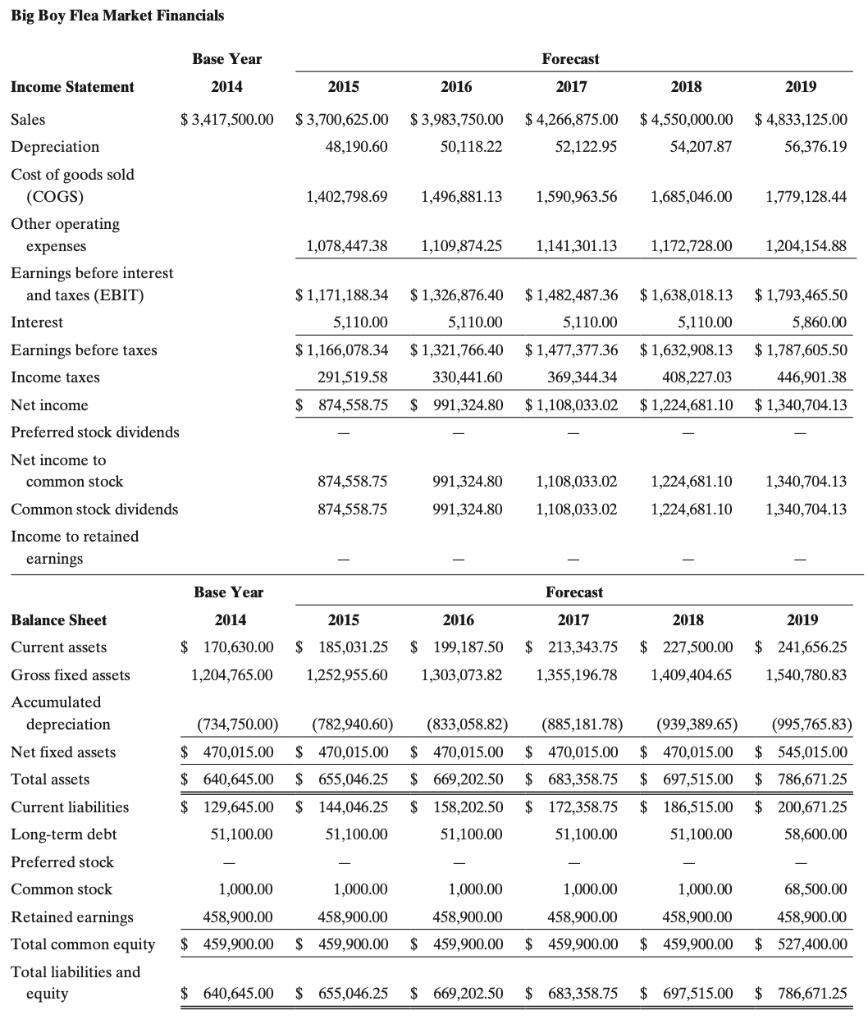
Big Boy Flea Market Financials Income Statement Sales Depreciation Cost of goods sold (COGS) Other operating expenses Earnings before interest. and taxes (EBIT) Interest Earnings before taxes Income taxes Net income Preferred stock dividends Net income to common stock Common stock dividends Income to retained earnings Balance Sheet Current assets Gross fixed assets Accumulated depreciation Net fixed assets Total assets Current liabilities Long-term debt Preferred stock Common stock Retained earnings Total common equity Total liabilities and equity Base Year 2014 $ 3,417,500.00 Base Year 2015 $ 3,700,625.00 48,190.60 1,402,798.69 1,078,447.38 $ 1,171,188.34 5,110.00 2016 874,558.75 874,558.75 $ 3,983,750.00 50,118.22 $ 1,326,876.40 $1,166,078.34 5,110.00 $1,321,766.40 330,441.60 291,519.58 $ 874,558.75 $ 991,324.80 1,109,874.25 Forecast 2017 1,496,881.13 1,590,963.56 $4,266,875.00 52,122.95 1,141,301.13 $1,482,487.36 5,110.00 $1,477,377.36 369,344.34 $1,108,033.02 2018 $4,550,000.00 54,207.87 1,685,046.00 1,172,728.00 $1,638,018.13 5,110.00 $1,632,908.13. 408,227.03 $1,224,681.10 1,108,033.02 1,224,681.10 991,324.80 991,324.80 1,108,033.02 1,224,681.10 2019 $4,833,125.00 56,376.19 1,779,128.44 1,204,154.88 $ 1,793,465.50 5,860.00 $ 1,787,605.50 446,901.38 $ 1,340,704.13 1,340,704.13 1,340,704.13 Forecast 2017 2014 2015 2016 2018 2019 $ 170,630.00 $ 185,031.25 $ 199,187.50 $ 213,343.75 $ 227,500.00 $ 241,656.25 1,204,765.00 1,252,955.60 1,303,073.82 1,355,196.78 1,409,404.65 1,540,780.83 (734,750.00) (782,940.60) (833,058.82) (885,181.78) (939,389.65) (995,765.83) $ 470,015.00 $ 470,015.00 $ 470,015.00 $ 470,015.00 $ 470,015.00 $ 545,015.00 $ 640,645.00 $ 655,046.25 $ 669,202.50 $ 683,358.75 $ 697,515.00 $ 786,671.25 $ 129,645.00 $ 144,046.25 $ 158,202.50 $ 172,358.75 $ 186,515.00 $ 200,671.25 51,100.00 51,100.00 51,100.00 51,100.00 51,100.00 58,600.00 1,000.00 1,000.00 1,000.00 1,000.00 1,000.00 68,500.00 458,900.00 458,900.00 458,900.00 458,900.00 458,900.00 458,900.00 $ 459,900.00 $ 459,900.00 $ 459,900.00 $ 459,900.00 $ 459,900.00 $ 527,400.00 $ 640,645.00 $ 655,046.25 $ 669,202.50 $ 683,358.75 $ 697,515.00 $786,671.25
Step by Step Solution
3.41 Rating (164 Votes )
There are 3 Steps involved in it

Get step-by-step solutions from verified subject matter experts