

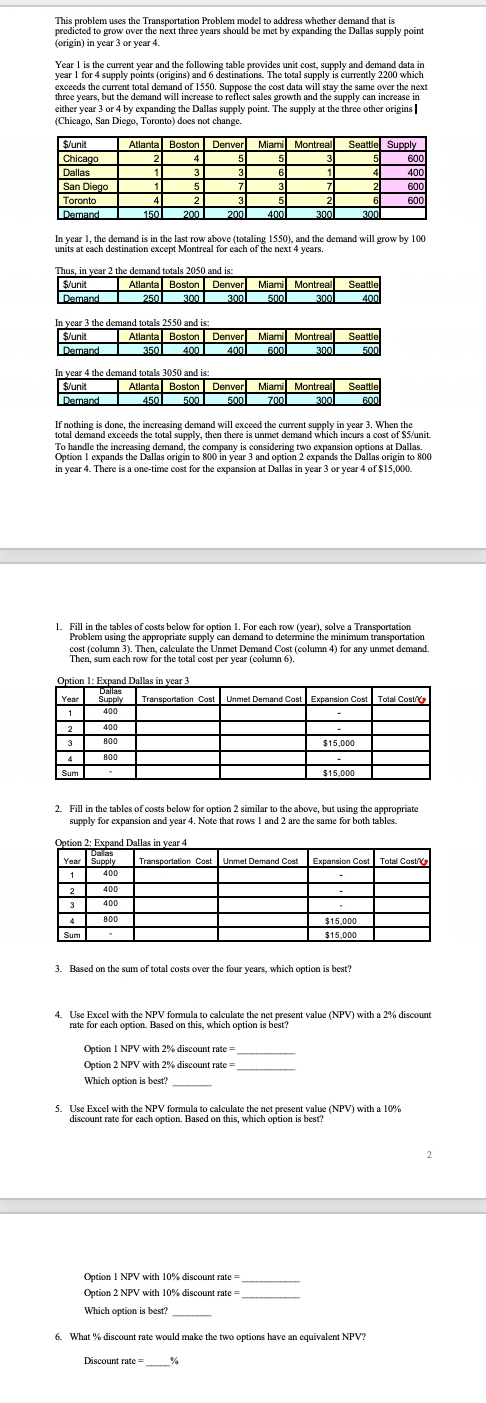
Question: This problem uses the Transportation Problem model to address whether demand that is predicted to grow over the next three years should be met by
This problem uses the Transportation Problem model to address whether demand that is
predicted to grow over the next three years should be met by expanding the Dallas supply point
origin in year or year
Year is the current year and the following table provides unit cost, supply and demand data in
year for supply points origins and destinations. The total supply is currently which
year for supply points origins and destinations.
exceeds the current total demand of Suppose the cost data will stay the same over the next
either year or by expanding the Dallas supply point. The supply at the three other origins
Chicago San Diego, Toronto does not change.
In year the demand is in the last row above totaling and the demand will grow by
units at each destination except Montreal for each of the next years.
Thus, in year the demand totals and is:
In year the demand totals and is:
In year the demand totals and is:
If nothing is done, the increasing demand will exceed the current supply in year When the
total demand exceeds the total supply, then there is unmet demand which incurs a cost of $unit
To handle the increasing demand, the company is considering two expansion options at Dallas
Option expands the Dallas origin to in year and option expands the Dallas origin to
in year There is a onetime cost for the expansion at Dallas in year or year of $
Fill in the tables of costs below for option For each row year solve a Transportation
Problem using the appropriate supply can demand to determine the minimum transportation
Problem using the appropriate supply can demand to determine the minimum transportation
Then, sum each row for the total cost per year column
Fill in the tables of costs below for option similar to the above, but using the appropriate
supply for expansion and year Note that rows and are the same for both tables
Option : Expand Dallas in year
Based on the sum of total costs over the four years, which option is best?
Use Excel with the NPV formula to calculate the net present value NPV with a discount
rate for each option. Based on this, which option is best?
Option with discount rate
Option NPV with discount rate
Which option is best?
Use Excel with the NPV formula to calculate the net present value NPV with a
discount rate for each option. Based on this, which option is best?
Option NPV with discount rate
Option NPV with discount rate
Which option is best?
What discount rate would make the two options have an equivalent NPV
Step by Step Solution
There are 3 Steps involved in it
1 Expert Approved Answer
Step: 1 Unlock

Question Has Been Solved by an Expert!
Get step-by-step solutions from verified subject matter experts
Step: 2 Unlock
Step: 3 Unlock