Question: This program is to be written in C sharp help please. The assignment is to write a program to produce the output shown below. The
This program is to be written in C sharp help please.
The assignment is to write a program to produce the output shown below. The data for flow and height is to
be read from a file and stored in two one-dimensional arrays (called Q and h). The data for hx is to be stored in another one dimensional array and statically initialized.
You will need to write several functions.
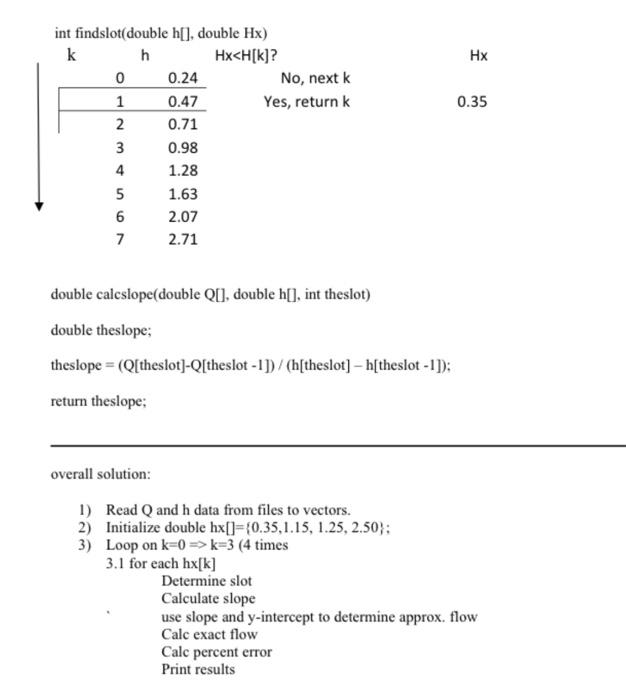
-The first is a ,slot, function which determines the index of hx (the parameter to slot) i.e. the table entry where
hx fits between h1 and h2.
-The second function ,slope, returns the slope of the line (based upon the slot of
hx).
-The third function, sec_order, returns the exact value for hc.
-The fourth function,perror, computes the percent error between Qx and QY
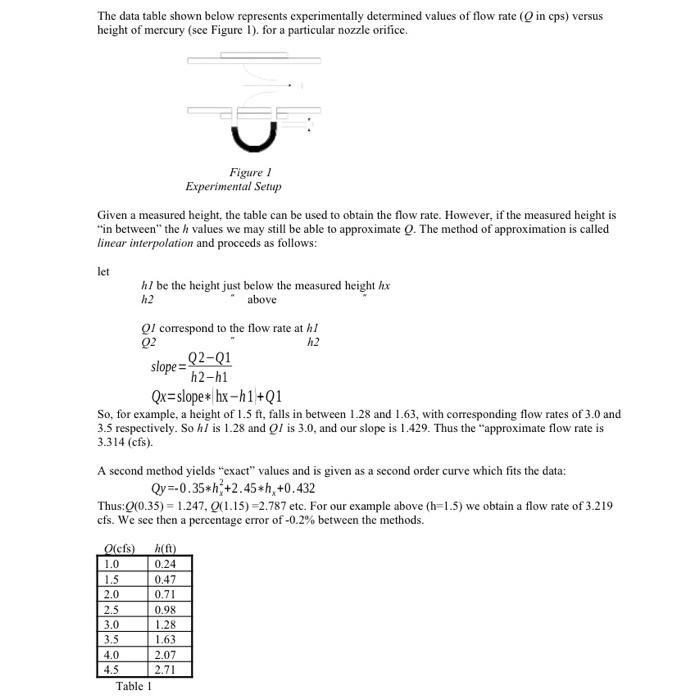
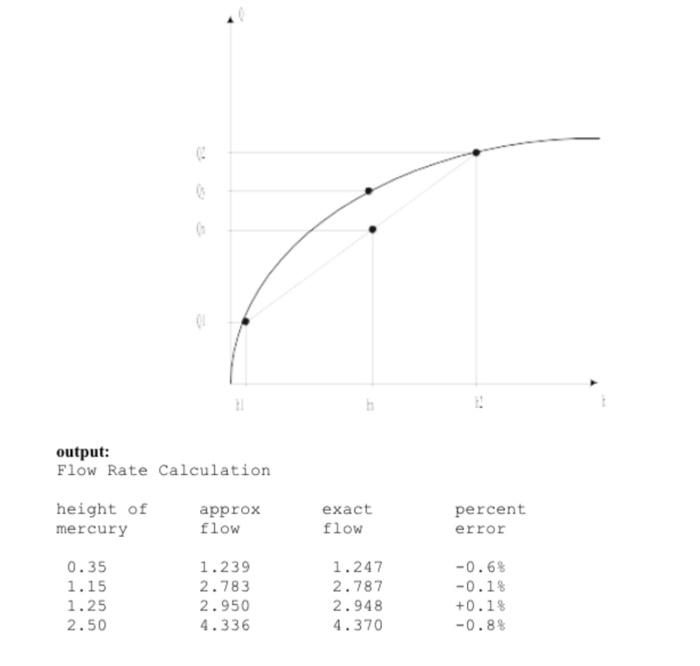
The data table shown below represents experimentally determined values of flow rate ( in cps) versus height of mercury (see Figure 1). for a particular nozzle orifice. Figure 1 Experimental Setup Given a measured height, the table can be used to obtain the flow rate. However, if the measured height is "in between the h values we may still be able to approximate Q. The method of approximation is called linear interpolation and proceeds as follows: let hl be the height just below the measured height hx h2 above QI correspond to the flow rate at hl Q2 h2 slope=92-01 h2-h1 QxEslope* hx -h1+Q1 So, for example, a height of 1.5 ft, falls in between 1.28 and 1.63, with corresponding flow rates of 3.0 and 3.5 respectively. So hl is 1.28 and QI is 3.0, and our slope is 1.429. Thus the approximate flow rate is 3.314 (cfs). A second method yields "exact" values and is given as a second order curve which fits the data: Qy=-0.35*h*+2.45*h, +0.432 Thus:Q(0.35) = 1.247. (1.15)=2.787 etc. For our example above (h=1.5) we obtain a flow rate of 3.219 cfs. We see then a percentage error of -0.2% between the methods. Qlcfs) h() 1.0 0.24 1.5 0.47 2.0 0.71 2.5 0.98 1.28 3.5 1.63 4.0 2.07 4.5 2.71 Table 1 3.0 output: Flow Rate Calculation height of mercury approx flow exact flow percent error 0.35 1.15 1.25 2.50 1.239 2.783 2.950 4.336 1.247 2.787 2.948 4.370 -0.6% -0.1% +0.1% -0.8% H 0.35 int findslot(double h[], double Hx) kh Hx k=3 (4 times 3.1 for each hx[k] Determine slot Calculate slope use slope and y-intercept to determine approx. flow Calc exact flow Calc percent error Print results The data table shown below represents experimentally determined values of flow rate ( in cps) versus height of mercury (see Figure 1). for a particular nozzle orifice. Figure 1 Experimental Setup Given a measured height, the table can be used to obtain the flow rate. However, if the measured height is "in between the h values we may still be able to approximate Q. The method of approximation is called linear interpolation and proceeds as follows: let hl be the height just below the measured height hx h2 above QI correspond to the flow rate at hl Q2 h2 slope=92-01 h2-h1 QxEslope* hx -h1+Q1 So, for example, a height of 1.5 ft, falls in between 1.28 and 1.63, with corresponding flow rates of 3.0 and 3.5 respectively. So hl is 1.28 and QI is 3.0, and our slope is 1.429. Thus the approximate flow rate is 3.314 (cfs). A second method yields "exact" values and is given as a second order curve which fits the data: Qy=-0.35*h*+2.45*h, +0.432 Thus:Q(0.35) = 1.247. (1.15)=2.787 etc. For our example above (h=1.5) we obtain a flow rate of 3.219 cfs. We see then a percentage error of -0.2% between the methods. Qlcfs) h() 1.0 0.24 1.5 0.47 2.0 0.71 2.5 0.98 1.28 3.5 1.63 4.0 2.07 4.5 2.71 Table 1 3.0 output: Flow Rate Calculation height of mercury approx flow exact flow percent error 0.35 1.15 1.25 2.50 1.239 2.783 2.950 4.336 1.247 2.787 2.948 4.370 -0.6% -0.1% +0.1% -0.8% H 0.35 int findslot(double h[], double Hx) kh Hx k=3 (4 times 3.1 for each hx[k] Determine slot Calculate slope use slope and y-intercept to determine approx. flow Calc exact flow Calc percent error Print results