

Question: This programming assignment will exercise your C programming muscles while also enabling you to visualize an essential fact about statistics: the Central Limit Theorem _.
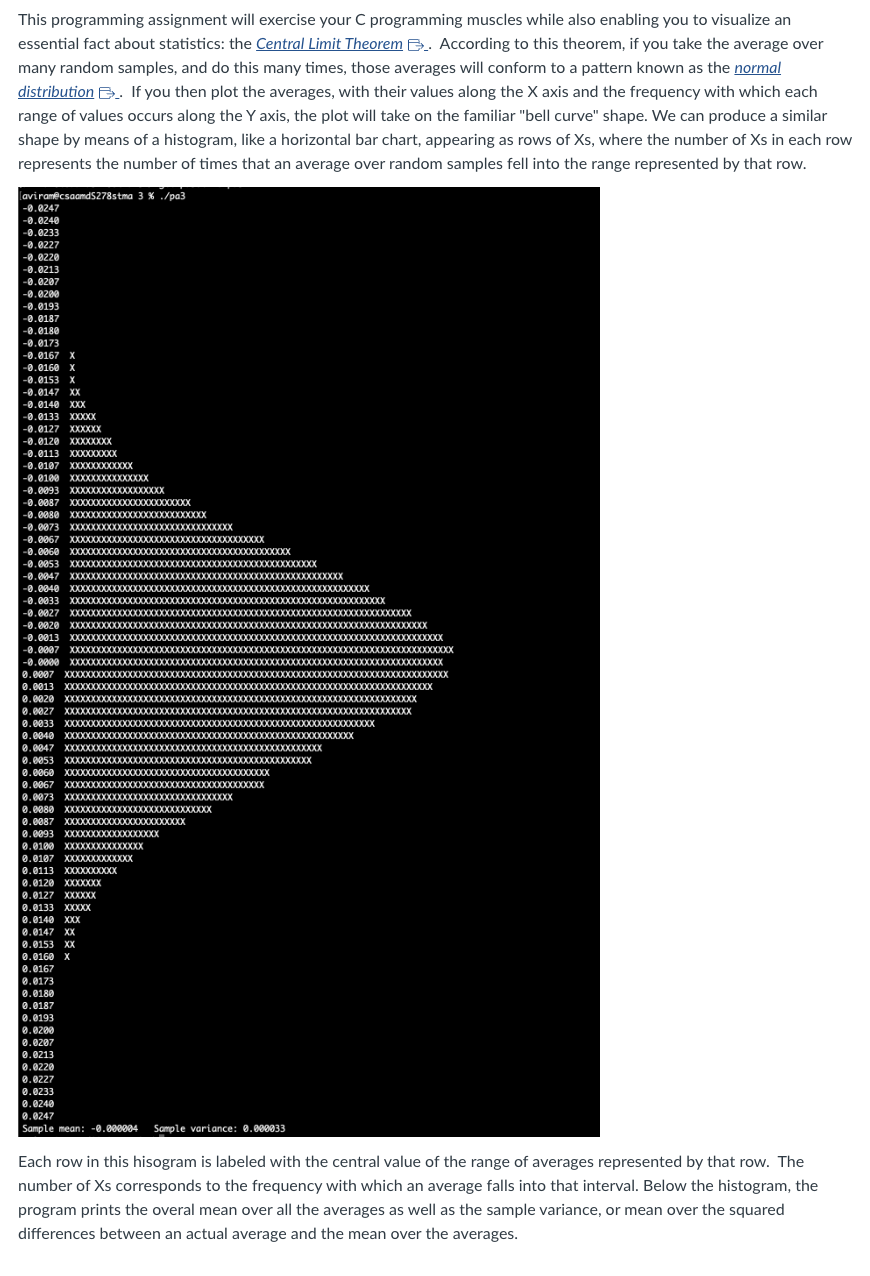
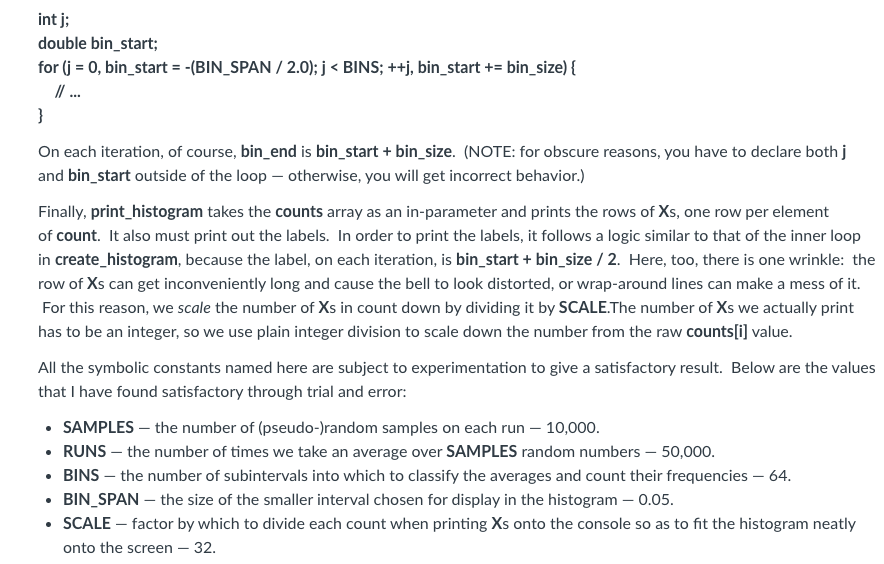
This programming assignment will exercise your C programming muscles while also enabling you to visualize an essential fact about statistics: the Central Limit Theorem _. According to this theorem, if you take the average over many random samples, and do this many times, those averages will conform to a pattern known as the normal distribution .. If you then plot the averages, with their values along the X axis and the frequency with which each range of values occurs along the Y axis, the plot will take on the familiar "bell curve" shape. We can produce a similar shape by means of a histogram, like a horizontal bar chart, appearing as rows of Xs, where the number of Xs in each row represents the number of times that an average over random samples fell into the range represented by that row. Each row in this hisogram is labeled with the central value of the range of averages represented by that row. The number of Xs corresponds to the frequency with which an average falls into that interval. Below the histogram, the program prints the overal mean over all the averages as well as the sample variance, or mean over the squared differences between an actual average and the mean over the averages. Details We start by computing the mean over many random samples: get_mean_of_uniform_random_samples. Define a symbolic constant, SAMPLES, for the number of (pseudo-)random samples to be taken to make up this mean. Then call the C Standard Library function rand , declared in stdlib.h, that number of times. Accumulate the sum of those values - as a double - and then, after all iterations are complete, divide the sum by SAMPLES. Now, rand returns an int value in the range [0, RAND_MAX], where RAND_MAX is an implementation-dependent but big integer value. Such an integer value is not exactly what we need for our purposes. Instead, we need a rational number value between 1 and 1 and centered around 0 , so that wen can aim for a mean of 0 . To get such a value, we transform the results of rand with some straightforward arithmetic: - Divide the result by RAND_MAX. using rational number division (In order to do this, cast at least one operand to type double and store the result in a variable of type double.) This gives a rational number value in [0.0,1.0]. - Multiply by 2.0. This gives a rational number value in [0.0,2.0]. - Subtract 1.0. This gives the desired value in [1.0,1.0]. Be sure to cast both dividend and divisor to type double before the first division to ensure rational number division rather than integer division, and use variables and constants of type double from that point onward. Recall that the compiler reads a numeric literal with a decimal point in it as having type double. Create a main function so that you can call get_mean_of_uniform_random_samples and print the result to test whether it looks reasonable. You might want to call the function in a loop and print the values so that you can see whether they tend toward 0 , which should be the mean over the means. Next, we need a function to call get_mean_of_uniform_random_samples repeatedly for RUNS times (where we define RUNS as another symbolic constant) and stores the return values in an array, values, passed in as an outparameter. Since we are already iterating over RUNS, this function should also accumulate a sum over all those averages, and then, after populating the values array (containing the averages), divide the sum by RUNS (using rational number division - which will happen automatically so long as sum has type double) and return it as the mean over the sample averages. So this function is called populate_values_and_get_mean. It reutrns the mean over the averages as a double. To test your program thus far, allocate an array of RUNS elements, each of type double, in main and call populate_values_and_get_mean. Use malloc _ or calloc B _to allocate the required memory space on the heap. (Note that malloc takes one parameter, the number of bytes to be allocated. DO NOT USE A NUMERIC LITERAL! Use arithmetic in the argument to compute the number of bytes. calloc takes two arguments, the number of elements in the array and the number of bytes in each element. Again, use computational methods to arrive at the latter value. calloc has the advantage of zero-initializing the array, but, in this particular case, you do not need to have that, since you never read the elements of values until after you have set the values in populate_values_and_get_mean.) Then call populate_values_and_get_mean, storing the returned mean and passing in values as an out-parameter. Verify that the result looks right. A separate function, get_mean_squared_error, takes the values array and the mean calculated by a call to populate_values_and_get_mean - as in-parameters - and returns the mean squared error over the values. Each error is the difference between the actual value in values and the mean passed in. Iterating through values, square the error and add that result to the running sum. Then return the sum divided by RUNS. Again, make sure that you do rational number arithmetic. Again, test this function from main. Another function, create_histogram, takes the values array as an in-parameter and an array of int, counts, as an outparameter, and populates the counts with counts of the values occurring within the bounds to be defined for the respective ranges ("bins" (or "buckets") associated with the elements of counts. So counts[0] holds the count of values (averages) occurring within the lowest range, counts[1] the count of values occurring within the second-lowest range, etc. There are BINS elements in counts, i.e., BINS "bins" into which we imagine tossing the values, where counts holds the numbers of values contained in those respective "bins." The general idea is to iterate over the values. For each value, we iterate over the bins, finding the lower and upper bounds for the current bin. If the value occurs within those bounds, we increment that count and then break out of the inner loop, since we know that the value will not belong in any other bin. There is a slight additional wrinkle to creating the histogram: as it happens, the more random samples you take on each run in RUNS, the closer the average for that run will approach the overall mean (i.e., 0), so values get bunched toward the center, which tends to obscure the "bell curve" appearance of the graph. To compensate, we shrink the range of bins of interest down from the original interval [1,1] to a smaller interval. The size of this smaller interval is BIN_SPAN. So the interval of interest for us is [-BIN_SPAN/2, BIN_SPAN/2], and the size of each bin, bin_size, is BIN_SPAN / (double)BINS. Putting these two concepts together, we can write the inner loop of create_histogram along these lines: double bin_start; for (j=0, bin_start = -(BIN_SPAN /2.0);j
Step by Step Solution
There are 3 Steps involved in it

Get step-by-step solutions from verified subject matter experts