

Question: This project counts as your assignment and your final assignment It involves your participation with weekly assignments that all count toward your final grade. Read
This project counts as your assignment and your final assignment It involves your participation with weekly assignments that all count toward your final grade. Read the instructions below Excel is very good at displaying data in a way that we can get useful information. However we need to gather data and then present our findings. One of the ways we gather data is over a certain amount of time. The time can be at regular intervals or over the course of days. For the next 5 weeks your task is to gather data on a subject approved by your instructor. Rules: Data must be collected at regular predetermined time intervals. Any missed interval could jeopardize the validity of your result. It has to be local and in a physical location where you must collect, view, or observe. Data collected cannot be already being measured or presented by another application (ie. financial or stocks on the internet). Scoring will be based on three factors for a total of 95 points: All data are present and valid (taken weekly) with a data collection worksheet (31.66 pts) Data are organized in a final spreadsheet with chart of choice along with MS Word summation (31.66 pts) Results are presented in the last week of the course (31.66 pts) In Weeks 5-8, there will be an assignment submission of your data collection. You will receive credit for each weekly submission along with the final project. Use Excel to measure something throughout the next five weeks. What will it be? Some suggestions: Food Prices in the local supermarket ( min. 10 products) Gas Prices in a certain location (comparing at least 2 stations) Working conditions in your employment (wide range of options) Neighborhood activity sales, business increase or decrease Household Utilities Expenses (Electricity usage, Gas, water, etc.) Remember all types of measurements are taken at regular intervals and must be kept accurate. Strict adherence to these disciplines gives your data validity. Otherwise your results can be challenged by critics. For more information on this subject and project requirements speak with your professor and get approval of your project prior to building the spreadsheet for data collection. At the end of your data collection we will build a spread sheet with graphs that depict the current trends we are measuring. For more detailed instructions consult your course instructor. Use this link as an example: Final Project Pricing Survey PDF
This project counts as your assignment and your final assignment It involves your participation with weekly assignments that all count toward your final grade. Read the instructions below
Excel is very good at displaying data in a way that we can get useful information. However we need to gather data and then present our findings. One of the ways we gather data is over a certain amount of time. The time can be at regular intervals or over the course of days. For the next 5 weeks your task is to gather data on a subject approved by your instructor. Rules: Data must be collected at regular predetermined time intervals. Any missed interval could jeopardize the validity of your result. It has to be local and in a physical location where you must collect, view, or observe. Data collected cannot be already being measured or presented by another application (ie. financial or stocks on the internet). Scoring will be based on three factors for a total of 95 points:
- All data are present and valid (taken weekly) with a data collection worksheet (31.66 pts)
- Data are organized in a final spreadsheet with chart of choice along with MS Word summation (31.66 pts)
- Results are presented in the last week of the course (31.66 pts)
In Weeks 5-8, there will be an assignment submission of your data collection. You will receive credit for each weekly submission along with the final project. Use Excel to measure something throughout the next five weeks. What will it be? Some suggestions:
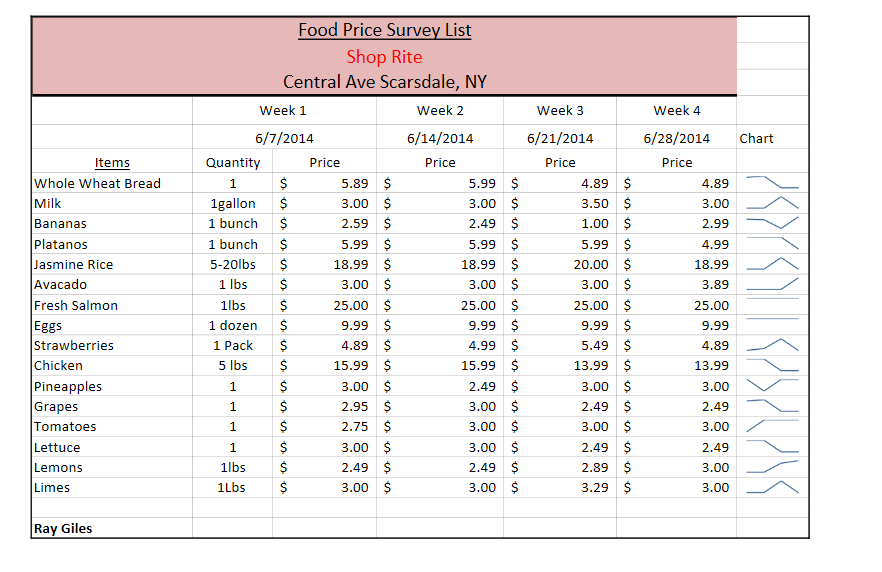
- Food Prices in the local supermarket ( min. 10 products)
- Gas Prices in a certain location (comparing at least 2 stations)
- Working conditions in your employment (wide range of options)
- Neighborhood activity sales, business increase or decrease
- Household Utilities Expenses (Electricity usage, Gas, water, etc.)
Remember all types of measurements are taken at regular intervals and must be kept accurate. Strict adherence to these disciplines gives your data validity. Otherwise your results can be challenged by critics. For more information on this subject and project requirements speak with your professor and get approval of your project prior to building the spreadsheet for data collection. At the end of your data collection we will build a spread sheet with graphs that depict the current trends we are measuring. For more detailed instructions consult your course instructor.
Use this link as an example: Final Project Pricing Survey PDF
Step by Step Solution
There are 3 Steps involved in it

Get step-by-step solutions from verified subject matter experts