

Question: This project involves determining the best fit polynomial approximating curve to the (H vs. ) data obtained from a pump manufacturer's catalog (units changed to
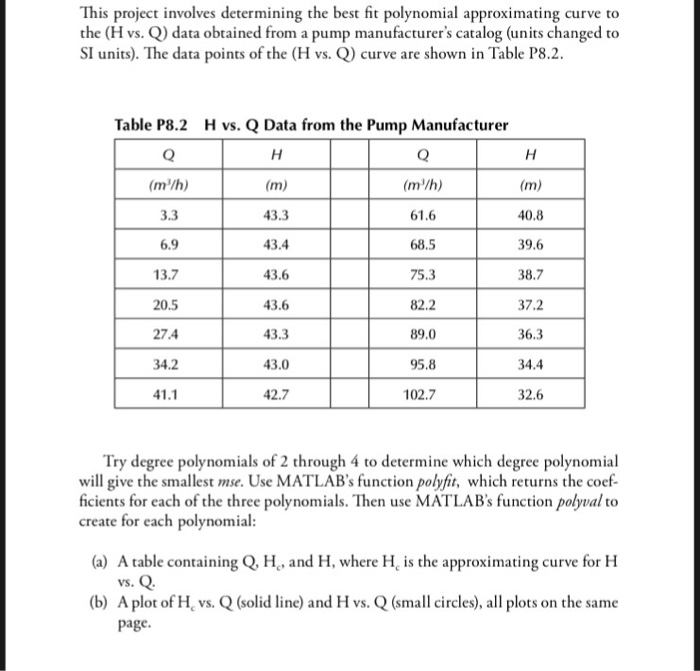
This project involves determining the best fit polynomial approximating curve to the (H vs. ) data obtained from a pump manufacturer's catalog (units changed to SI units). The data points of the (H vs. Q curve are shown in Table P8.2 Table P8.2 H vs. Q Data from the Pump Manufacturer 3.3 6.9 13.7 20.5 27.4 4.2 41.1 43.3 43.4 43.6 43.6 43.3 43.0 42.7 (m/h) 61.6 68.5 75.3 82.2 89.0 95.8 102.7 40.8 39.6 38.7 37.2 36.3 34.4 32.6 Try degree polynomials of 2 through 4 to determine which degree polynomial will give the smallest mse. Use MATLAB's function polyfit, which returns the coef- ficients for each of the three polynomials. Then use MATLAB's function polyval to create for each polynomial (a) A table containing Q, H., and H, where H is the approximating curve for H Vs (b) A plot of H, vs. Q (solid line) and H vs. Q (small circles), all plots on the same page
Step by Step Solution
There are 3 Steps involved in it

Get step-by-step solutions from verified subject matter experts