

Question: This project relates to statistical modeling with focus on using regression techniques to model and predict health expenditure in Africa. Instructions: Use the attached
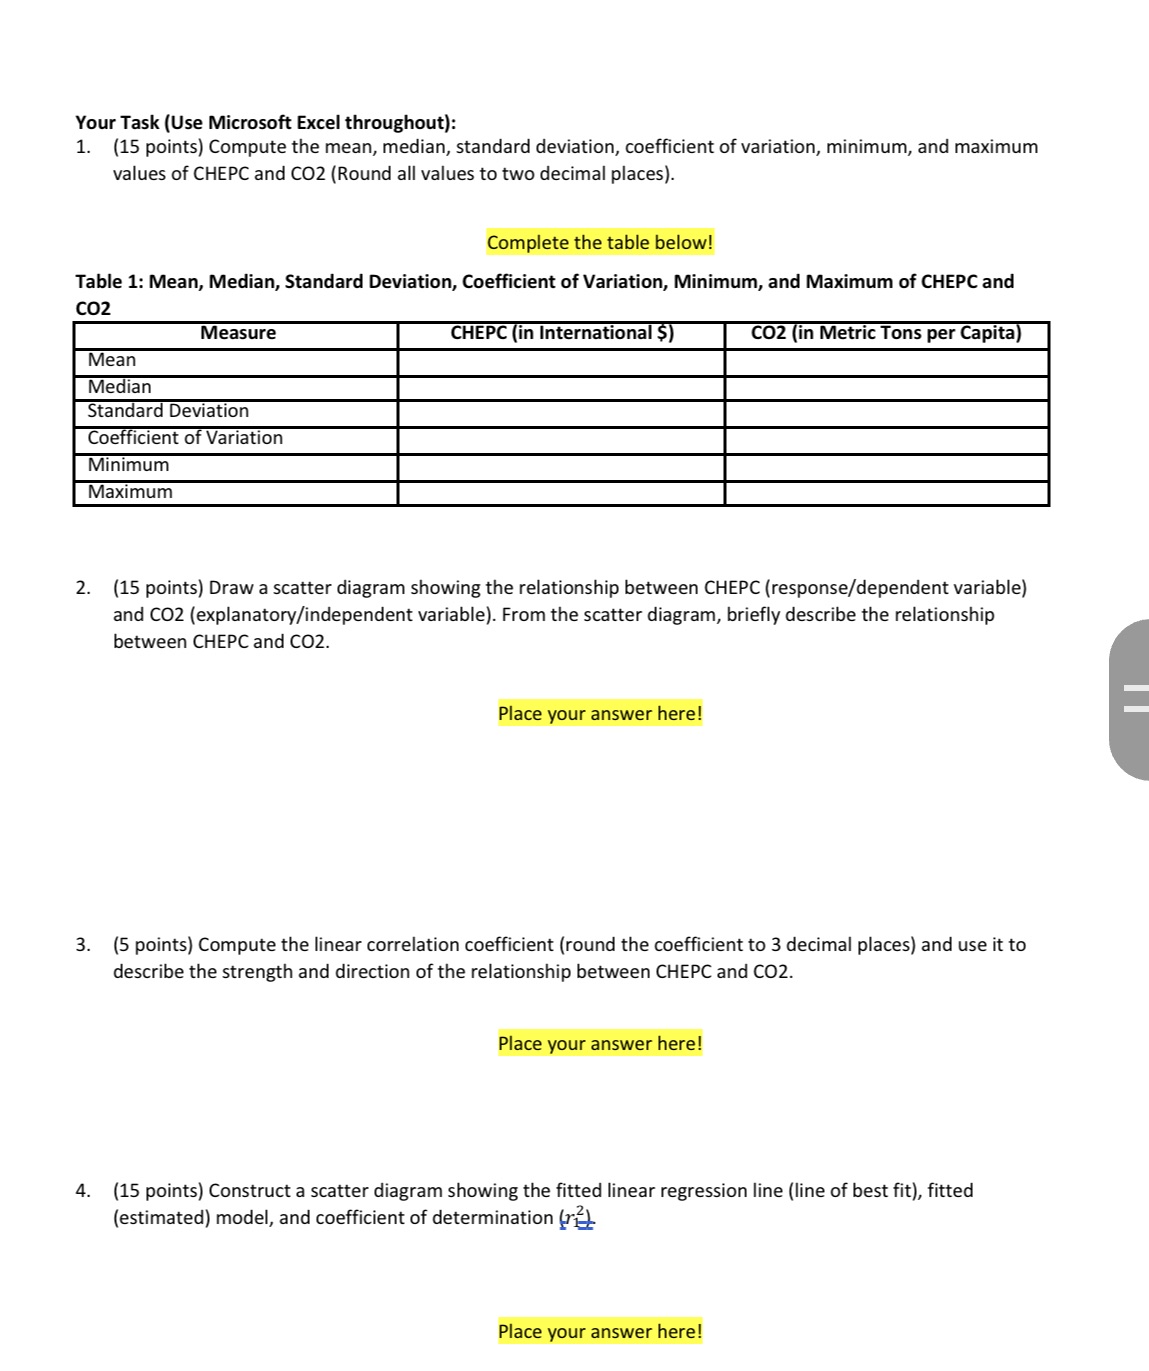
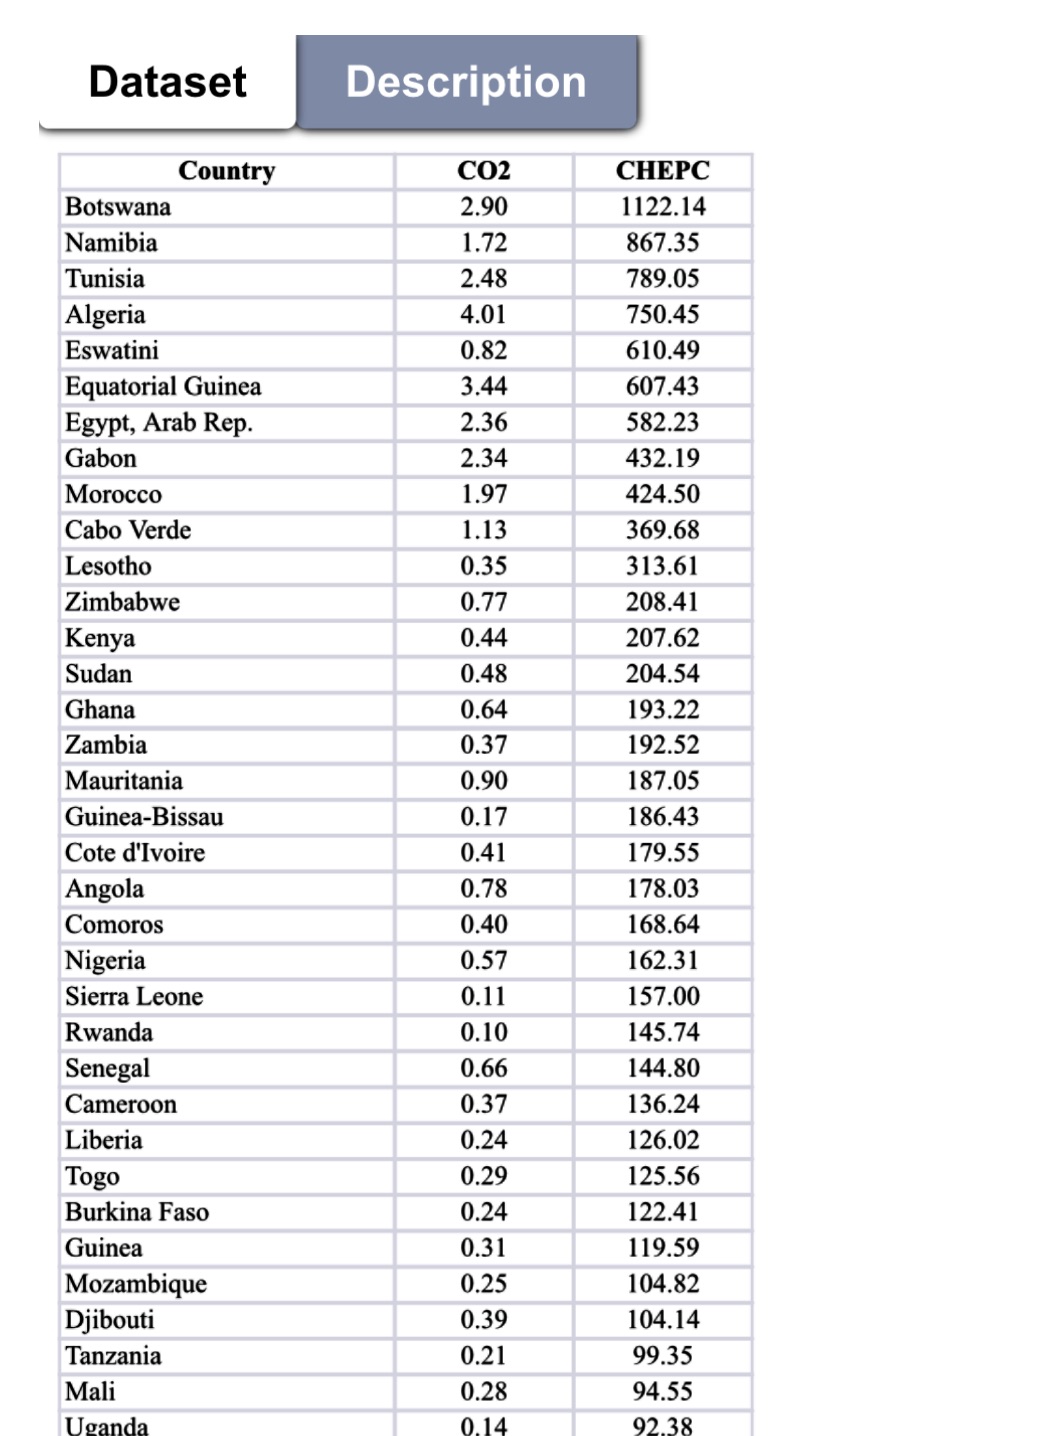
This project relates to statistical modeling with focus on using regression techniques to model and predict health expenditure in Africa. Instructions: Use the attached data set in excel to complete the tasks. Once you are done with the tasks, upload your work as a single word file on canvas. . Appoint one member of the group to unload the completed assignment on behalf of the group on canvas no later the at 11:59 pm Cal Time. Resources (Make sure to review these resourced for standing the project): . Calculating mean, median, mode, standard deviation, minimum, and maximum (in Excel). https://www.youtube.com/watch?v=7A8dAYeulL4 https://www.youtube.com/watch?v=rk09wUnW61Q Calculating the coefficient of variation (in Excel): O https://www.youtube.com/watch?v=0l1wzkuKS6Y https://www.youtube.com/watch?v=kRLTxYPI3_4 Scatter Diagram and Trendlines (in Excel) https://www.youtube.com/watch?v=kLROCLFZH80 https://www.youtube.com/watch?v=xp-2kvsHJ4U https://www.youtube.com/watch?v=rgs57VedJLU https://www.youtube.com/watch?v=aw-GluLZIWA Background and Purpose There are many elements that influence both population health and health expenditures, such as income level, pollution related to the level of industrialization, environmental quality, etc. Offering quality health care services should be one of the most essential objectives of governments because they can lead to improved life expectancy, social and economic welfare, etc. The deterioration of environmental quality globally has a substantial effect on what we call "healthy living". Therefore, this project is purposed on the development of regression models to predict Health Expenditure taking into consideration the effect of environmental degradation in Africa using World Bank data (www.data.worldbank.org). This project assumes current health expenditure per capita (CHEPC) measured in international dollars at purchasing power parity as a proxy for the health variable (i.e., response variable) and carbon dioxide emissions (CO2) measured in metric tons per capita as a proxy for the environmental variable (i.e., predictor variable). Your Task (Use Microsoft Excel throughout): 1. (15 points) Compute the mean, median, standard deviation, coefficient of variation, minimum, and maximum values of CHEPC and CO2 (Round all values to two decimal places). Complete the table below! Table 1: Mean, Median, Standard Deviation, Coefficient of Variation, Minimum, and Maximum of CHEPC and CO2 Mean Measure Median Standard Deviation Coefficient of Variation Minimum Maximum CHEPC (in International $) CO2 (in Metric Tons per Capita) 2. (15 points) Draw a scatter diagram showing the relationship between CHEPC (response/dependent variable) and CO2 (explanatory/independent variable). From the scatter diagram, briefly describe the relationship between CHEPC and CO2. Place your answer here! 3. (5 points) Compute the linear correlation coefficient (round the coefficient to 3 decimal places) and use it to describe the strength and direction of the relationship between CHEPC and CO2. Place your answer here! 4. (15 points) Construct a scatter diagram showing the fitted linear regression line (line of best fit), fitted (estimated) model, and coefficient of determination ( Place your answer here! Dataset Description Country CO2 CHEPC Botswana 2.90 1122.14 Namibia 1.72 867.35 Tunisia 2.48 789.05 Algeria 4.01 750.45 Eswatini 0.82 610.49 Equatorial Guinea 3.44 607.43 Egypt, Arab Rep. 2.36 582.23 Gabon 2.34 432.19 Morocco 1.97 424.50 Cabo Verde 1.13 369.68 Lesotho 0.35 313.61 Zimbabwe 0.77 208.41 Kenya 0.44 207.62 Sudan Ghana Zambia 0.48 204.54 0.64 193.22 0.37 192.52 Mauritania 0.90 187.05 Guinea-Bissau 0.17 186.43 Cote d'Ivoire 0.41 179.55 Angola 0.78 178.03 Comoros 0.40 168.64 Nigeria 0.57 162.31 Sierra Leone 0.11 157.00 Rwanda 0.10 145.74 Senegal 0.66 144.80 Cameroon 0.37 136.24 Liberia 0.24 126.02 Togo 0.29 125.56 Burkina Faso 0.24 122.41 Guinea 0.31 119.59 Mozambique 0.25 104.82 Djibouti 0.39 104.14 Tanzania 0.21 99.35 Mali 0.28 94.55 Uganda 0.14 92.38
Step by Step Solution
There are 3 Steps involved in it

Get step-by-step solutions from verified subject matter experts