

Question: This question: 1 point(s) possible Ethan and Drew went on a 10-day fishing trip. The number of smallmouth bass caught and released by the two
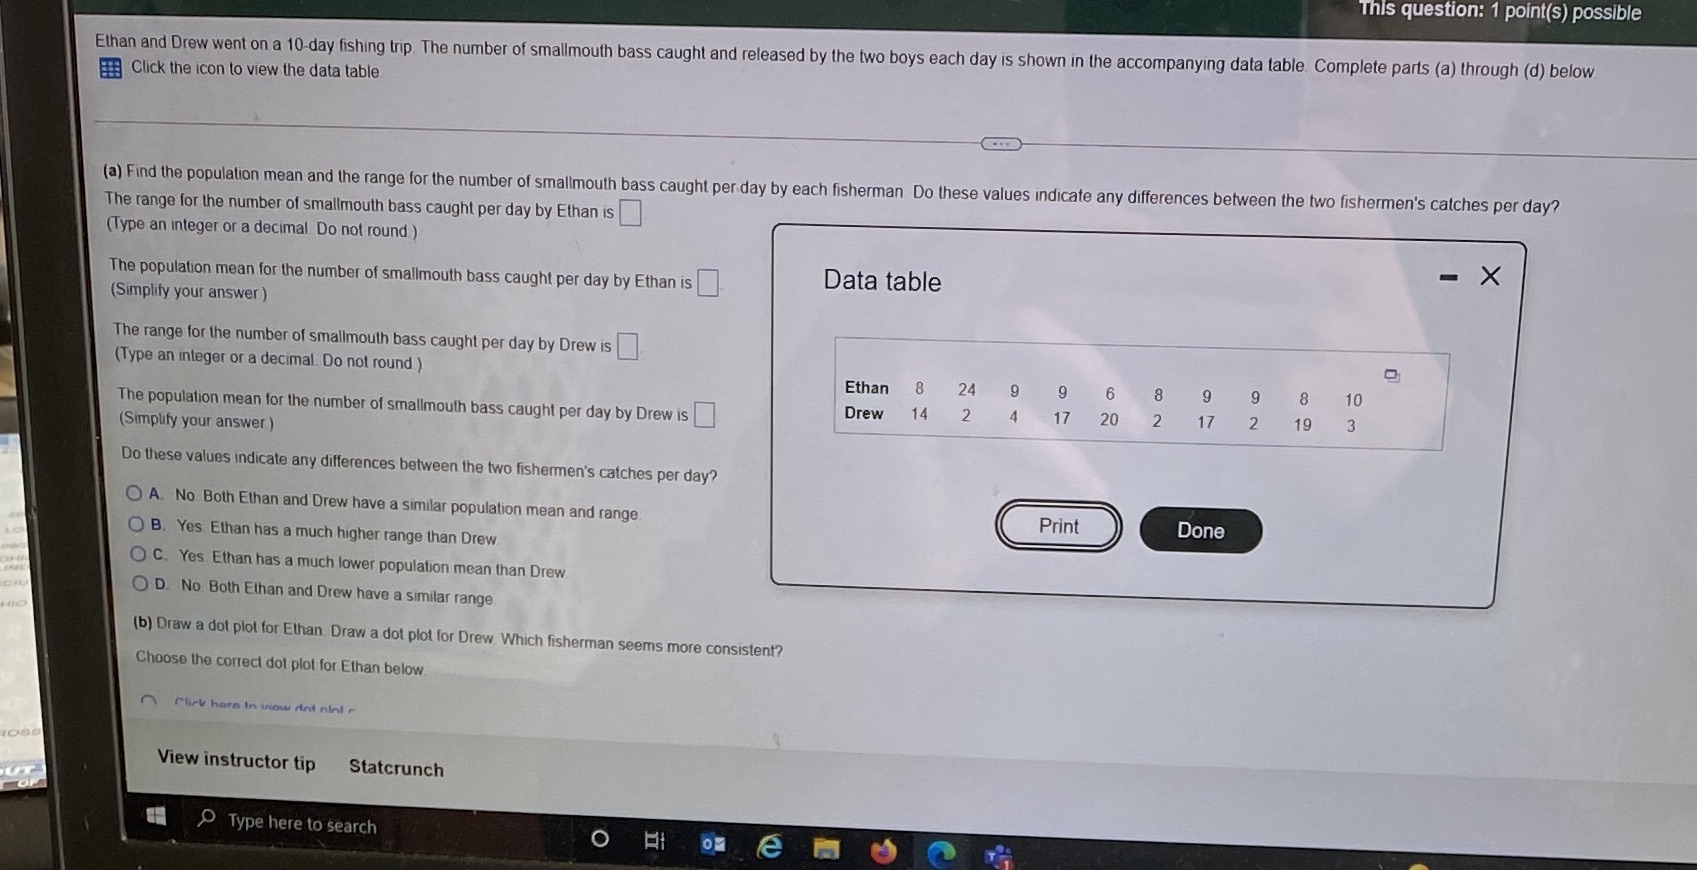
This question: 1 point(s) possible Ethan and Drew went on a 10-day fishing trip. The number of smallmouth bass caught and released by the two boys each day is shown in the accompanying data table. Complete parts (a) through (d) below Click the icon to view the data table (a) Find the population mean and the range for the number of smallmouth bass caught per day by each fisherman Do these values indicate any differences between the two fishermen's catches per day? The range for the number of smallmouth bass caught per day by Ethan is (Type an integer or a decimal Do not round ) - X The population mean for the number of smallmouth bass caught per day by Ethan is Data table (Simplify your answer ) The range for the number of smallmouth bass caught per day by Drew is (Type an integer or a decimal. Do not round ) Ethan 8 24 9 9 6 8 9 9 8 10 Drew 14 2 A 17 20 2 17 2 19 W The population mean for the number of smallmouth bass caught per day by Drew is (Simplify your answer ) Do these values indicate any differences between the two fishermen's catches per day? O A. No Both Ethan and Drew have a similar population mean and range Print Done O B. Yes Ethan has a much higher range than Drew O C. Yes Ethan has a much lower population mean than Drew O D. No Both Ethan and Drew have a similar range (b) Draw a dot plot for Ethan. Draw a dot plot for Drew Which fisherman seems more consistent? Choose the correct dot plot for Ethan below View instructor tip Statcrunch UT Type here to search O RI
Step by Step Solution
There are 3 Steps involved in it

Get step-by-step solutions from verified subject matter experts