

Question: This question: 1 point(s) possible Submit quiz Fuel economy estimates for automobiles built one year predicted a mean of 25.2 mpg and a standard
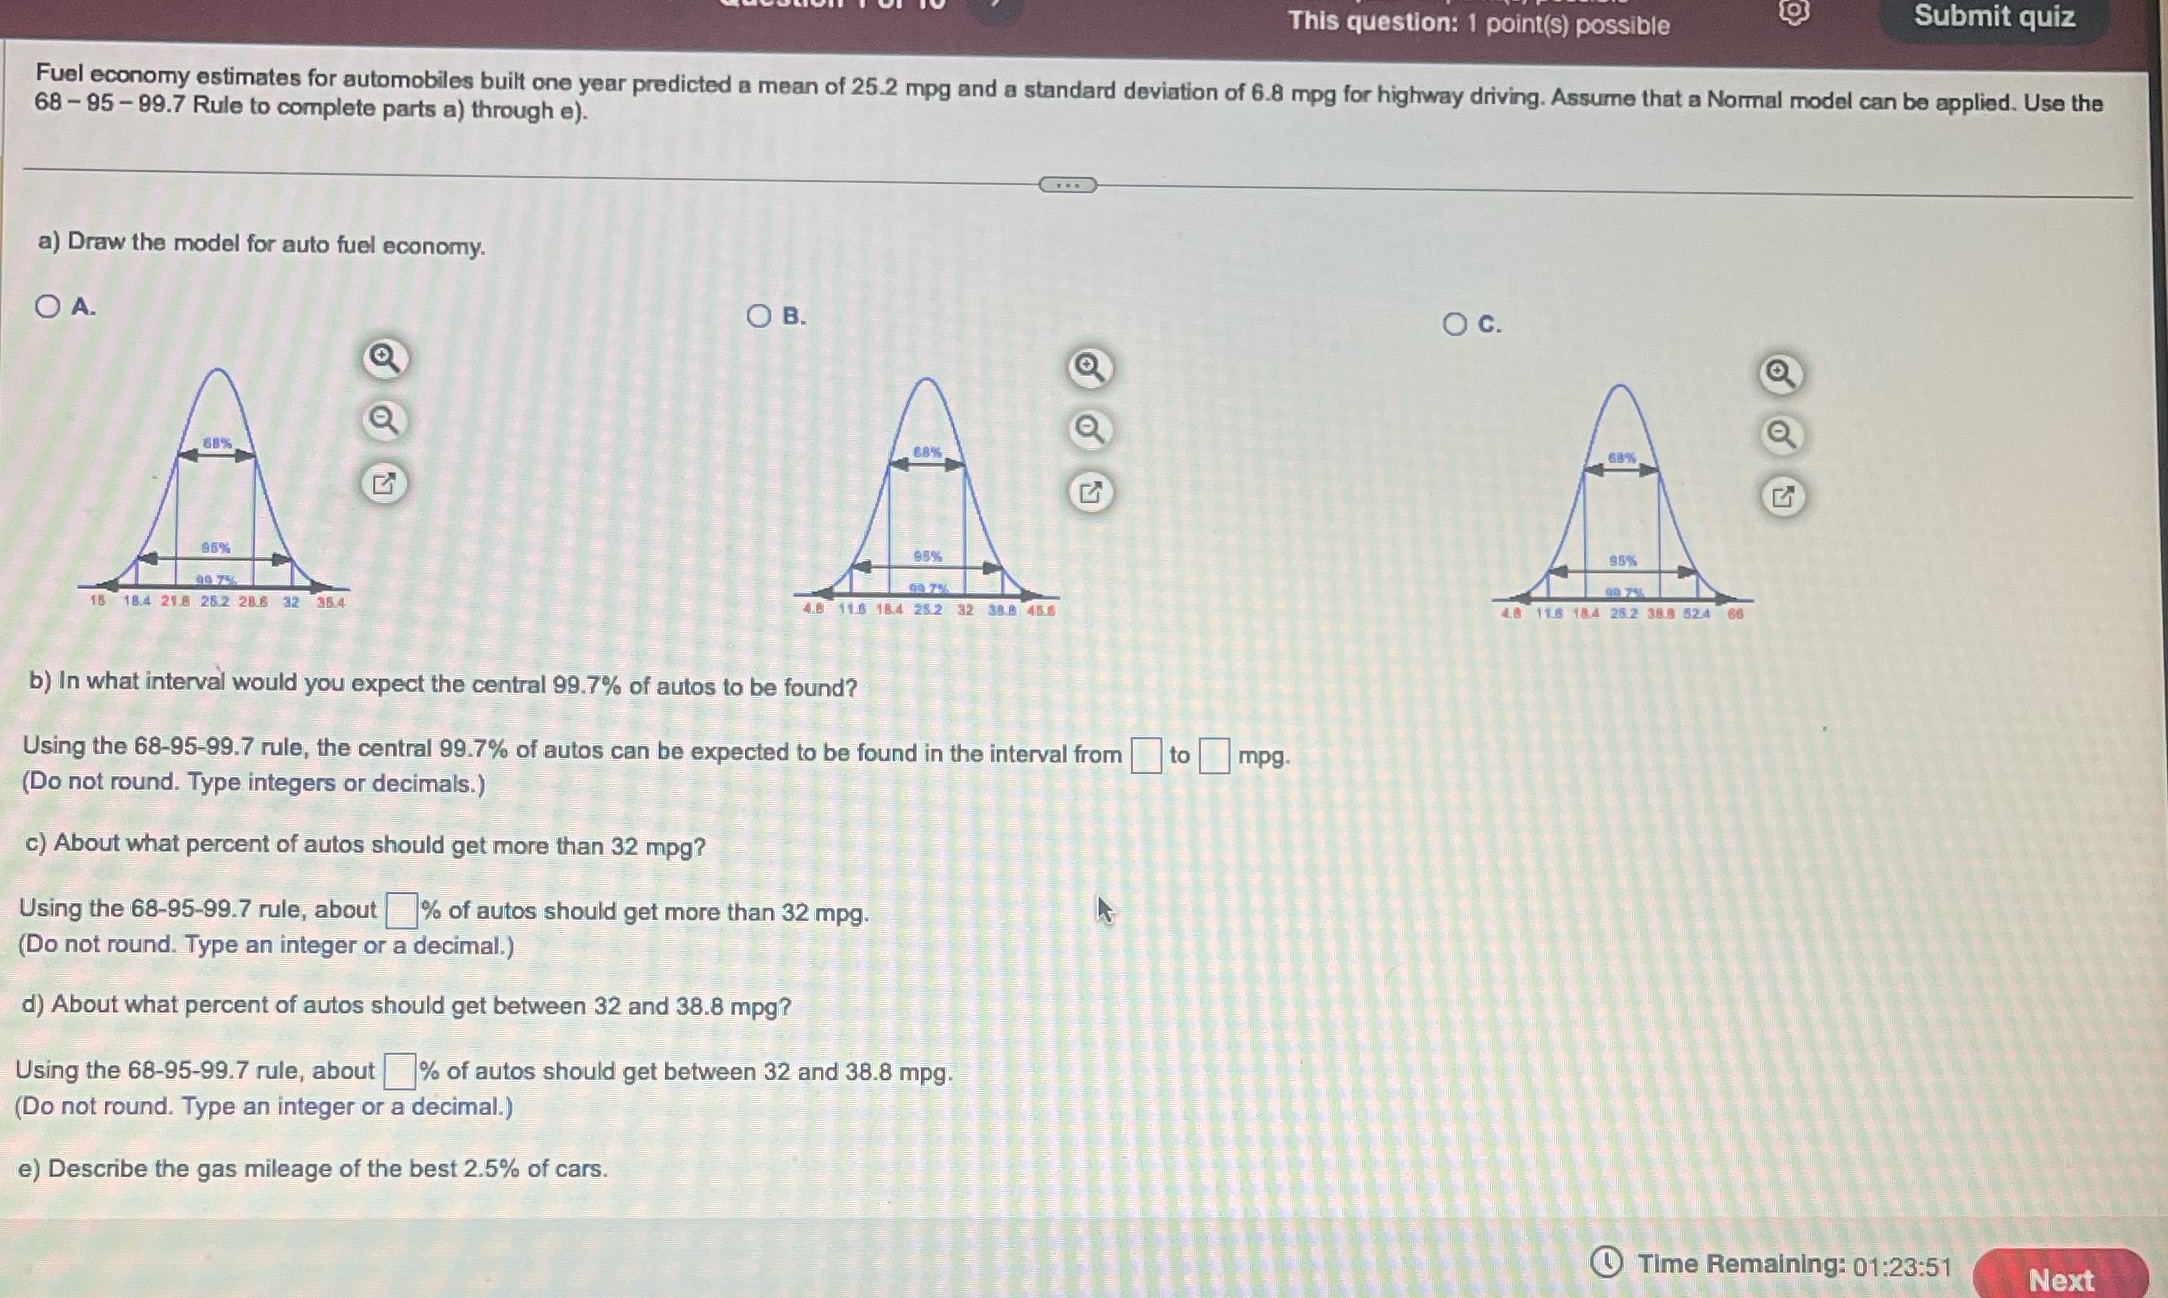
This question: 1 point(s) possible Submit quiz Fuel economy estimates for automobiles built one year predicted a mean of 25.2 mpg and a standard deviation of 6.8 mpg for highway driving. Assume that a Normal model can be applied. Use the 68-95-99.7 Rule to complete parts a) through e). a) Draw the model for auto fuel economy. O A. Q 68% G 95% 99 75 15 18.4 21.8 25.2 28.6 32 35.4 O B. 68% G 95% 99 7% 4.8 11.5 18.4 25.2 32 38.8 45.6 b) In what interval would you expect the central 99.7% of autos to be found? Using the 68-95-99.7 rule, the central 99.7% of autos can be expected to be found in the interval from (Do not round. Type integers or decimals.) c) About what percent of autos should get more than 32 mpg? Using the 68-95-99.7 rule, about % of autos should get more than 32 mpg. (Do not round. Type an integer or a decimal.) d) About what percent of autos should get between 32 and 38.8 mpg? Using the 68-95-99.7 rule, about % of autos should get between 32 and 38.8 mpg. (Do not round. Type an integer or a decimal.) e) Describe the gas mileage of the best 2.5% of cars. to mpg. C. 63% 95% 99.7% 4.8 11.6 18.4 25.2 38.8 524 66 Time Remaining: 01:23:51 Next
Step by Step Solution
There are 3 Steps involved in it

Get step-by-step solutions from verified subject matter experts