

Question: This question: 1 point(s) possible Submit quiz in list Draw a labour supply curve and a labour demand curve. Label them LS, and LDo- Real
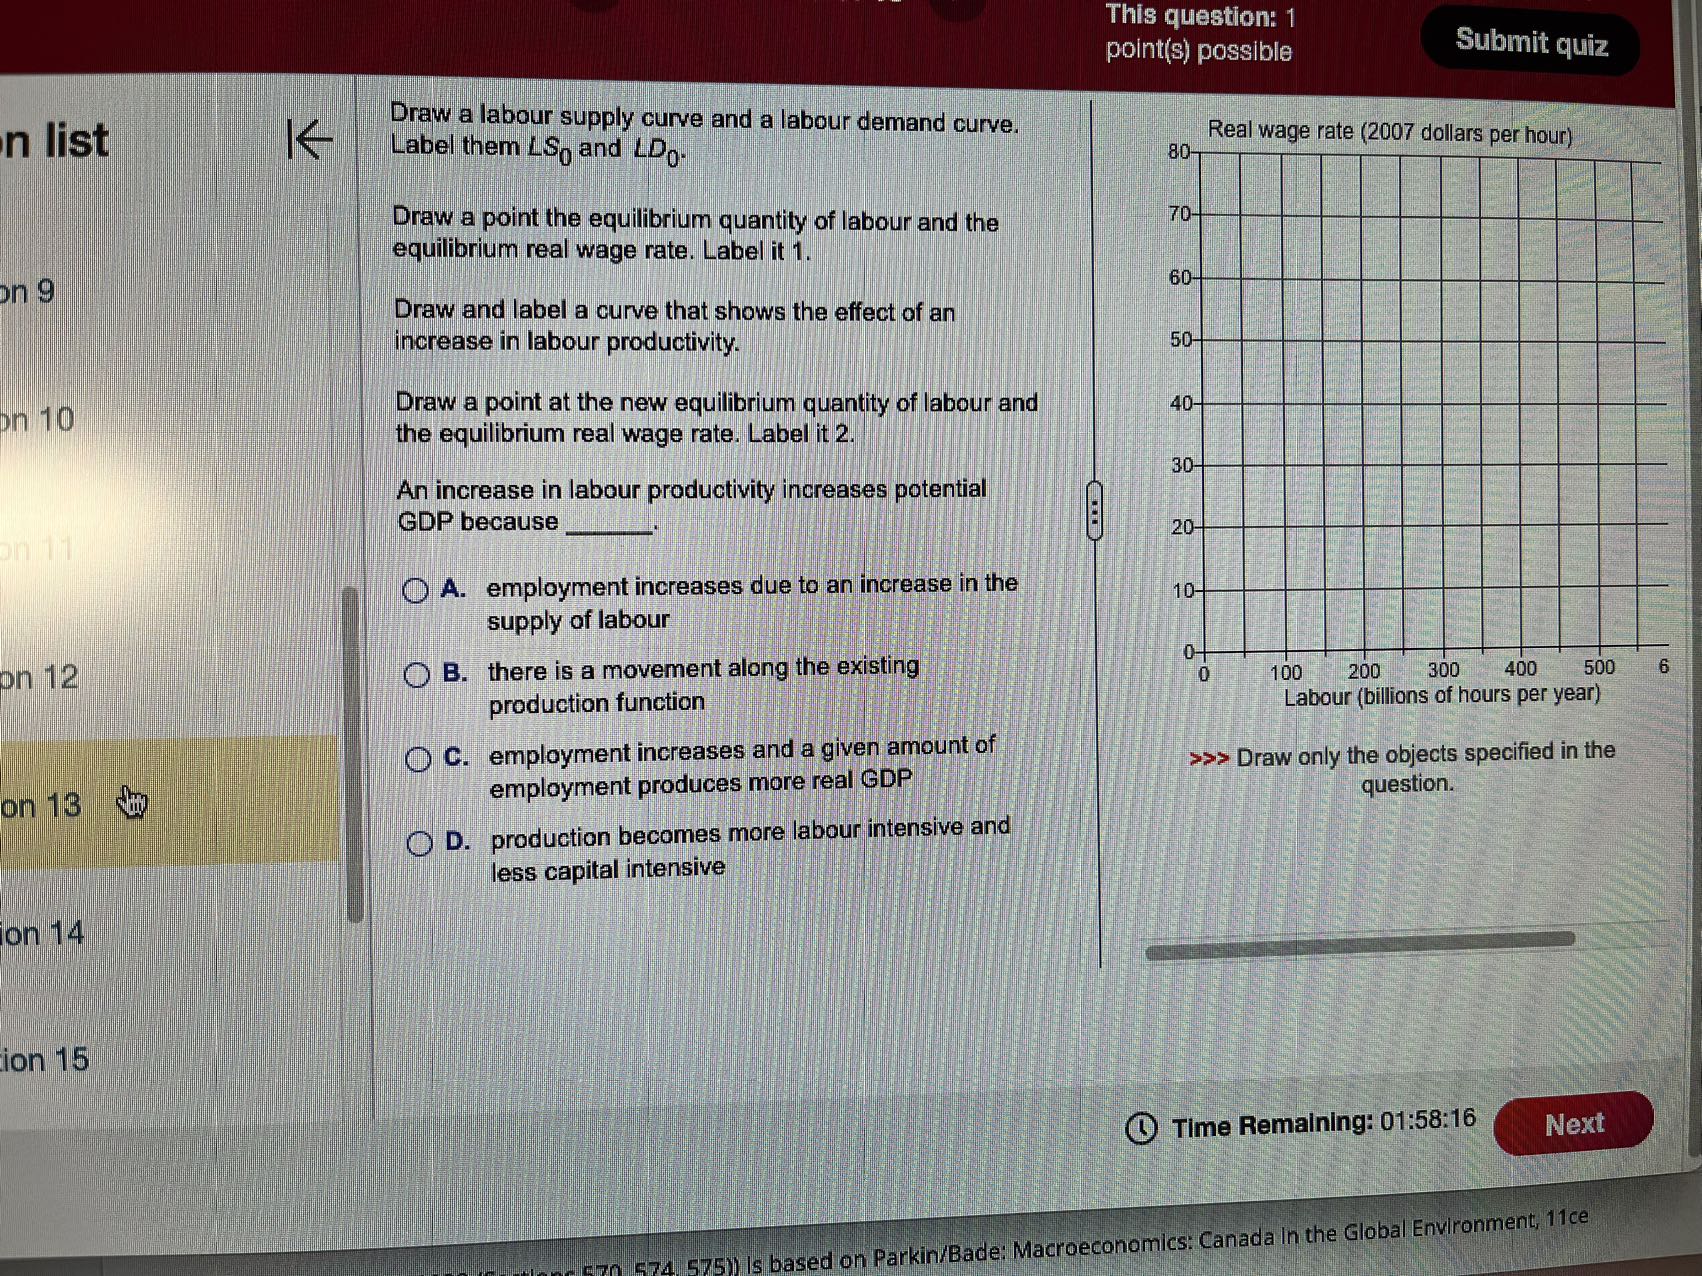
This question: 1 point(s) possible Submit quiz in list Draw a labour supply curve and a labour demand curve. Label them LS, and LDo- Real wage rate (2007 dollars per hour) 80- Draw a point the equilibrium quantity of labour and the 70 equilibrium real wage rate. Label it 1. on 9 Draw and label a curve that shows the effect of an increase in labour productivity. 50 on 10 Draw a point at the new equilibrium quantity of labour and 40 the equilibrium real wage rate. Label it 2 30 An increase in labour productivity increases potential GDP because_ 20 OA. employment increases due to an increase in the 10- supply of labour on 12 O B. there is a movement along the existing production function 100 200 300 400 500 6 Labour (billions of hours per year) O C. employment increases and a given amount of >>> Draw only the objects specified in the on 13 employment produces more real GDP question. D. production becomes more labour intensive and less capital intensive on 14 ion 15 Time Remaining: 01:58:16 Next 575)) Is based on Parkin/Bade: Macroeconomics: Canada In the Global Environment, 11ce
Step by Step Solution
There are 3 Steps involved in it

Get step-by-step solutions from verified subject matter experts