

Question: This question: 1 point(s) possible Submit test Find the equation of the regression line for the given data. Then construct a scatter plot of the
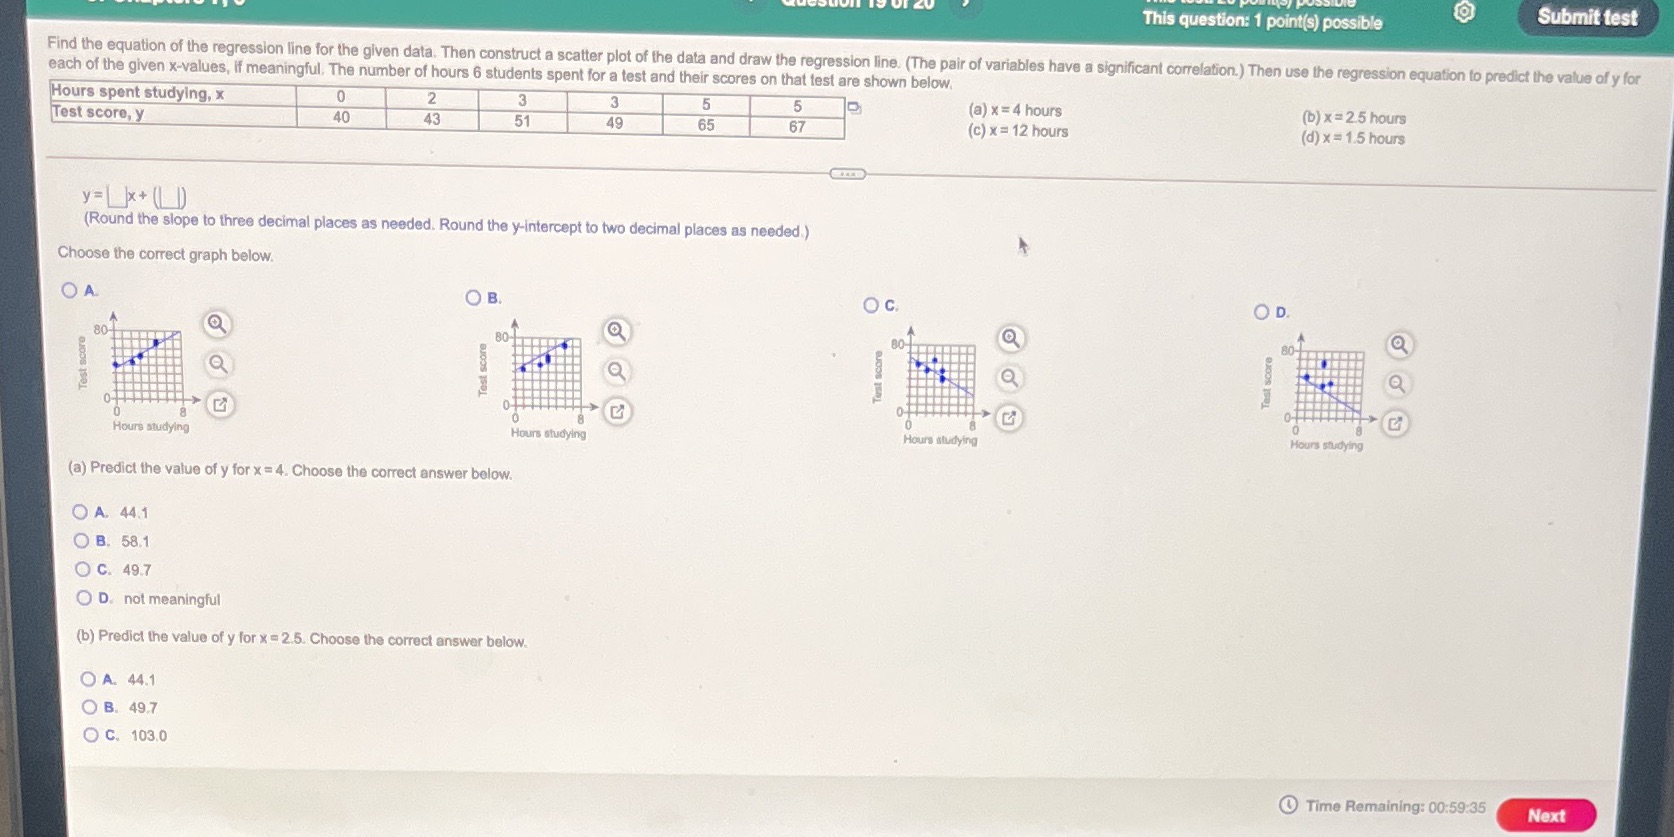
This question: 1 point(s) possible Submit test Find the equation of the regression line for the given data. Then construct a scatter plot of the data and draw the regression line. (The pair of variables have a significant correlation.) Then use the regression equation to predict the value of y for each of the given x-values, if meaningful. The number of hours 6 students spent for a test and their scores on that test are shown below. Hours spent studying, x 0 2 3 3 5 5 (a) x = 4 hours (b) x =2.5 hours Test score, y 40 43 51 49 65 67 (c) x = 12 hours (d) x = 1.5 hours y=]x + (L D) (Round the slope to three decimal places as needed. Round the y-intercept to two decimal places as needed.) Choose the correct graph below. OA O B. O C. O D. 80 BO- 80- core Test score Q Test score Test score Test Hours studying Hours studying Hours studying Hours studying (a) Predict the value of y for x = 4. Choose the correct answer below. O A. 44.1 O B. 58.1 O C. 49.7 O D. not meaningful (b) Predict the value of y for x = 2.5. Choose the correct answer below. OA. 44.1 O B. 49.7 O C. 103.0 Time Remaining: 00:59:35 Next
Step by Step Solution
There are 3 Steps involved in it

Get step-by-step solutions from verified subject matter experts