

Question: This Question: 1 pt Explain what is misleading about the graphic. Annual Sales of Widgets at Company X Number of Widgets Sold 35,000 30,000
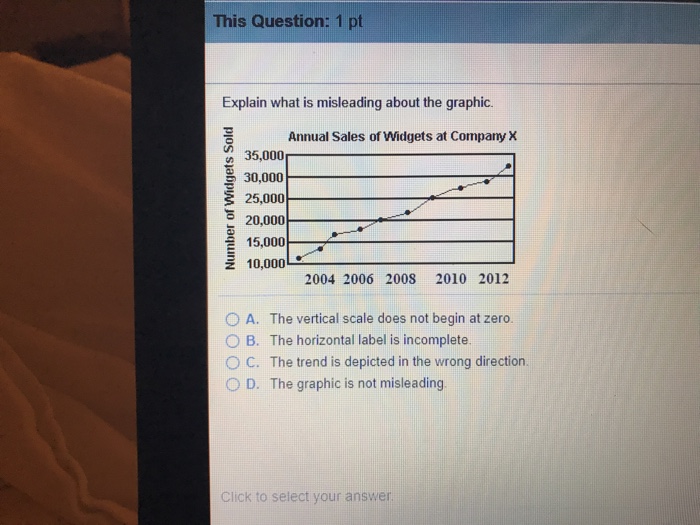
This Question: 1 pt Explain what is misleading about the graphic. Annual Sales of Widgets at Company X Number of Widgets Sold 35,000 30,000 25,000 20,000 15,000 10,000 2004 2006 2008 2010 2012 A. The vertical scale does not begin at zero. B. The horizontal label is incomplete. OC. The trend is depicted in the wrong direction. OD. The graphic is not misleading. Click to select your answer.
Step by Step Solution
There are 3 Steps involved in it
1 Expert Approved Answer
Step: 1 Unlock

Correct option B The vertical scale does n... View full answer
Question Has Been Solved by an Expert!
Get step-by-step solutions from verified subject matter experts
Step: 2 Unlock
Step: 3 Unlock