

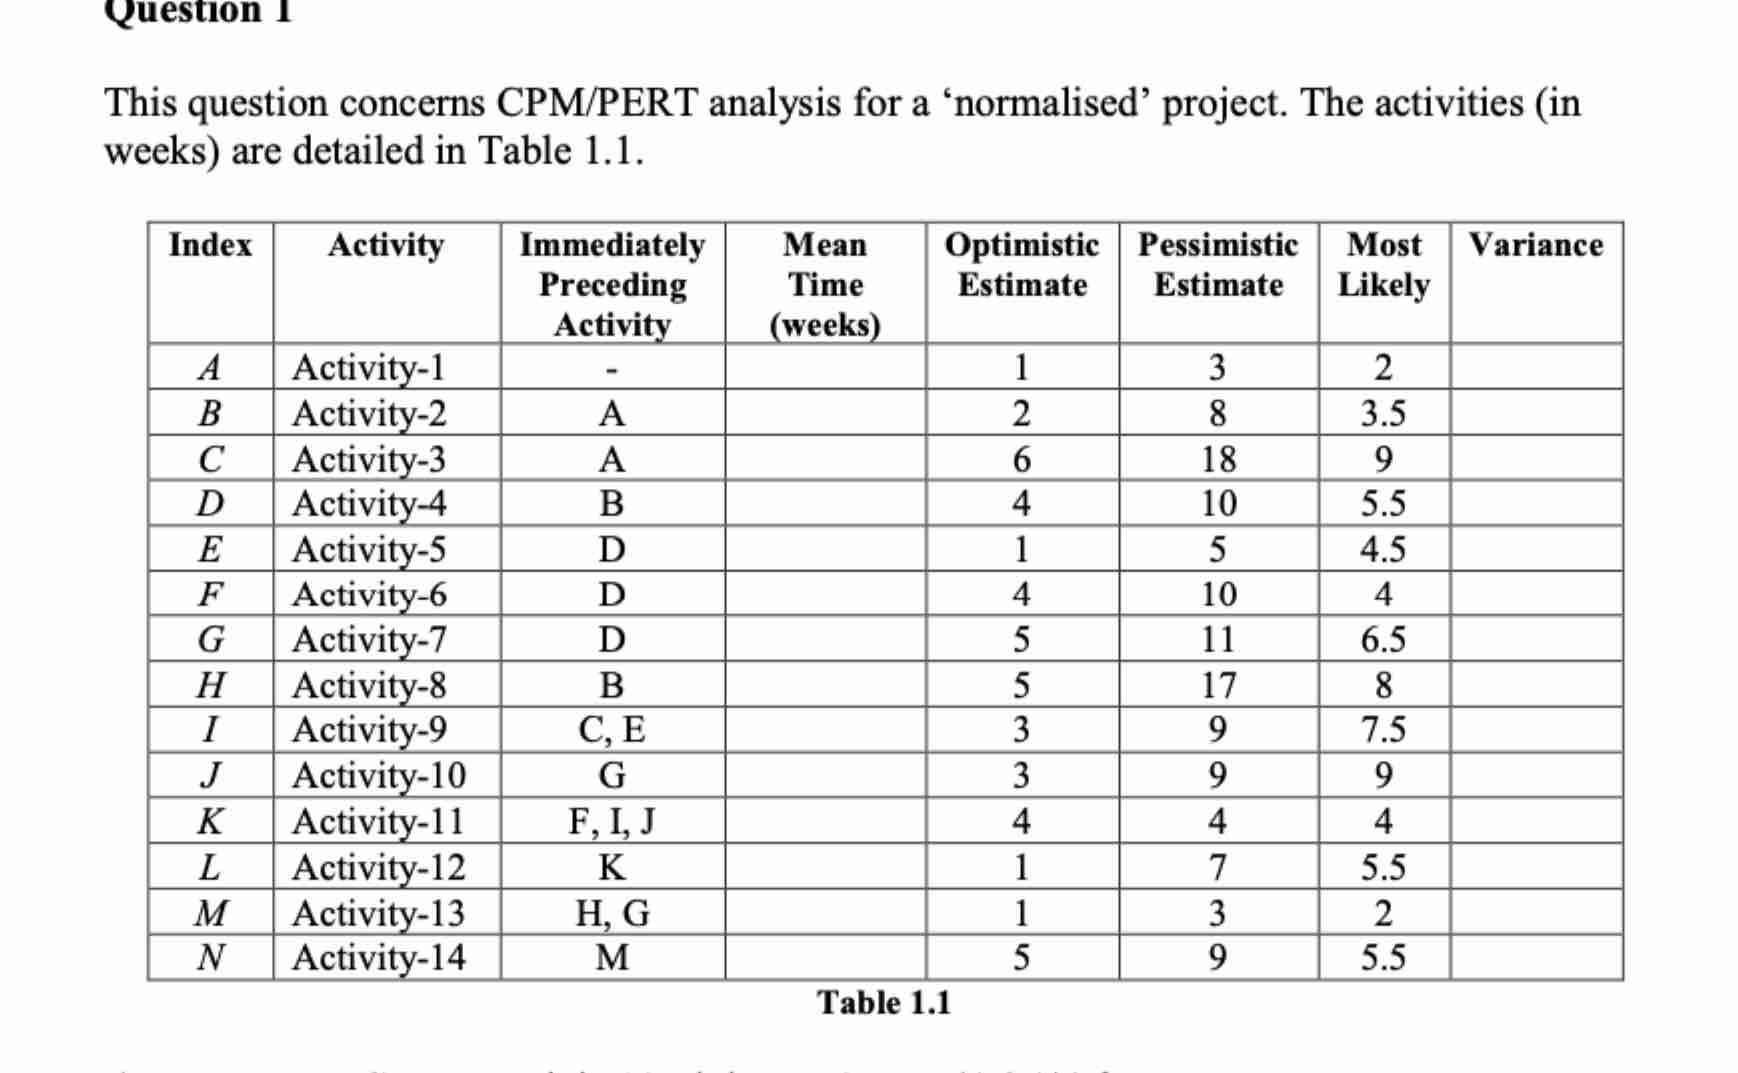
Question: This question concerns CPM / PERT analysis for a 'normalised' project. The activities ( in weeks ) are detailed in Table 1 . 1 .
This question concerns CPMPERT analysis for a 'normalised' project. The activities in weeks are detailed in Table
Index Activity
Immediately Preceding Activity
Mean Time weeks
Optimistic Estimate
Pessimistic Estimate
Most Likely
Variance A Activity B Activity A C Activity A D Activity B E Activity D F Activity D G Activity D H Activity B I Activity CE J Activity G K Activity F I, J L Activity K M Activity H G N Activity M
Table
Question
This question concerns CPMPERT analysis for a 'normalised' project. The activities in
weeksare detailed in Table
Table
aDraw a CP Network in 'Activity on node AONformat
bCalculate 'Mean Time' and 'Variance' for each activity
cUsing 'mean' durations to calculate 'earliest start', 'earliest finish', 'latest start',
'latest finish' and slack for each activity show on your network in a xxgrid
dIdentify the 'critical path' on your network and the next nearest 'critical path'.
eWhat is the probability this project will be completed in weeks Z tables are
attached.
fYour manager has indicated that the project should be completed in weeks and has
asked you to calculate the likelihood of the project being completed in this time; what
is the likelihood of this time being met?
gActivity time estimation is difficult for projects with new technology, comment on
this difficulty and identify processes that could improve estimation.
Step by Step Solution
There are 3 Steps involved in it
1 Expert Approved Answer
Step: 1 Unlock

Question Has Been Solved by an Expert!
Get step-by-step solutions from verified subject matter experts
Step: 2 Unlock
Step: 3 Unlock