

Question: This question is based on Chapter 5 problem 15 on page 135. (intermediate results with 4 decimal places; final answers with 2 decimal places) In
This question is based on Chapter 5 problem 15 on page 135. (intermediate results with 4 decimal places; final answers with 2 decimal places)
In day 6, the percentage of late arriving flights = % .
Sp =
CL =
UCL =
LCL =
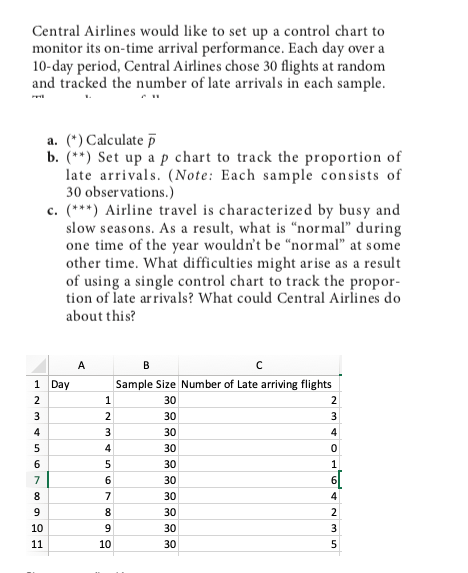
Central Airlines would like to set up a control chart to monitor its on-time arrival performance. Each day over a 10-day period, Central Airlines chose 30 flights at random and tracked the number of late arrivals in each sample. a. (*) Calculate 7 b. (**) Set up a p chart to track the proportion of late arrivals. (Note: Each sample consists of 30 observations.) c. (***) Airline travel is characterized by busy and slow seasons. As a result, what is "normal" during one time of the year wouldn't be normal at some other time. What difficulties might arise as a result of using a single control chart to track the propor- tion of late arrivals? What could Central Airlines do about this? A 1 Day 2 3 4 5 6 7 8 9 10 11 1 2 3 4 5 6 7 8 9 10 B Sample Size Number of Late arriving flights 30 2 30 3 30 4 30 0 30 1 30 30 4 30 2 30 3 30 5Step by Step Solution
There are 3 Steps involved in it
1 Expert Approved Answer
Step: 1 Unlock

Question Has Been Solved by an Expert!
Get step-by-step solutions from verified subject matter experts
Step: 2 Unlock
Step: 3 Unlock