

Question: This question is based on the information in the Table below. Scenario Investment A Investment B Investment C Investment D 3% 2% 3% 12% Outcome
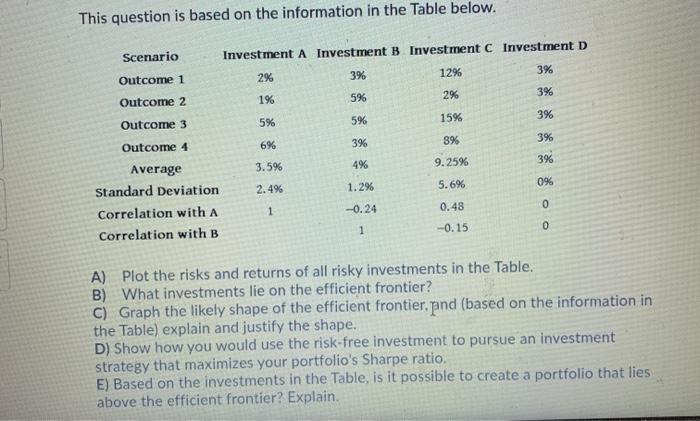
This question is based on the information in the Table below. Scenario Investment A Investment B Investment C Investment D 3% 2% 3% 12% Outcome 1 3% 1% 5% 2% Outcome 2 3% 5% 15% Outcome 3 5% 3% 8% 3% 6% Outcome 4 3% 3.5% 4% 9.25% 0% 2.4% 5.6% 1.2% Average Standard Deviation Correlation with A Correlation with B 0 1 0.48 -0.24 1 -0.15 0 A) Plot the risks and returns of all risky investments in the Table. B) What investments lie on the efficient frontier? C) Graph the likely shape of the efficient frontier, pnd (based on the information in the Table) explain and justify the shape. D) Show how you would use the risk-free investment to pursue an investment strategy that maximizes your portfolio's Sharpe ratio. E) Based on the investments in the Table, is it possible to create a portfolio that lies above the efficient frontier? Explain
Step by Step Solution
There are 3 Steps involved in it

Get step-by-step solutions from verified subject matter experts