

Question: This question is based to the stock data that can be obtained orn the following link: http:itbizni'ahoo.comfr:Ir Choose Research Tools and then Historical Quotes. Dbtain
![Quotes". Dbtain monthly stoclt data for 5 years [ll] months + one](https://s3.amazonaws.com/si.experts.images/answers/2024/06/6675196505435_24466751964e5f68.jpg)
![additional month] starting date: (mmddyyj lllEl and end date lUlEll. (Note: since](https://s3.amazonaws.com/si.experts.images/answers/2024/06/6675196557e0b_245667519654481d.jpg)

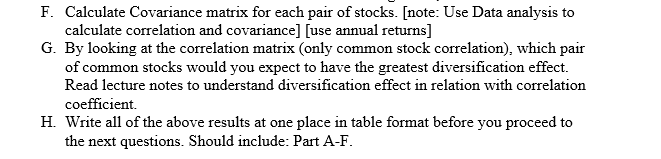
This question is based to the stock data that can be obtained orn the following link: http:it"bizni'ahoo.comfr:Ir "Choose Research Tools" and then "Historical Quotes". Dbtain monthly stoclt data for 5 years [ll] months + one additional month] starting date: (mmddyyj lllEl and end date lUlEll. (Note: since you will loss one data PH P P 1' price data). The stock tickers for the download are given as follows: point when calculating rate of returns i.e. ( 3| therefore y ou require ('51 month Please use three stocks as git. on below. ENDTE: Each group will hate AAPL W. 8351' 500 and T Bill same but the third common stock. In this assignment, I am using third stock as "CAT" but this will 'E-Ell'} across groups. 1) Apple Inc. \"AAPL\" 2) Amazon Inc. \"ALIEN\" 3) Caterpillar \"CAT\" 4) Tbills: use the following link to obtain to obtain monthly 5 years Tbill data (mmddyy) {lUlllo and end date lllEl) https:fe'research.stIonisfed.orgffredlfseriest'ESlt-[Sidownloaddata [l the date as required for this assignment, under Treasury bills, choose Threemonth bill and monthly data for the stated period.}. Note: Tbills are already in returns therefore you do not need to calculate percent returns as required for other stocks. But, you will calculate annual average returns. 5) SEEP S Composite: use the following link to obtain S&P 500 monthly 5 years data(mindd g] 12 l 215 and end date '31- EllEDIE]. ht :.i"fnance ahoo. com! '?s= AGEPCS: l=ll. 5&1: Sill} 1s used for market index 1.e. market return. How to arrange the data: Download data and keep in ascending order (i.e. 2015 first and 2021last value). Using the "adjusted close" column (delete rest of the columns except date), which is adjusted for stock splits and dividends. . compute monthly returns for companies in your portfolio and the S&P500, calculate monthly rate of returns using PIPE (ignore dividends if present). Note: do not worry about dividend data - ignore. Once all data is downloaded and dates are completely matched. Keep only first column for DATE i.e. period. . Add "Data analysis" and "Solver" to Excel. Go to file -> Options -> add- Ins -> Analysis ToolPak -> Go and OK -> check Analysis Toolpak box You have installed Data analysis. Go to DATA on the top menu and you will find Data analysis to right most top corner. Repeat the process to install SOLVER. Q.1: [5 marks each part = 5x9 = 45] A. Calculate annual average returns for each stock. Use monthly rate of returns to calculate annual average returns. You will have 5 annual returns. [take average of 12 months of each year]. For all next calculation, you will be referred to 5 annual returns rather than monthly returns. a. Calculate arithmetic average (mean) return of annual returns. [it will be one value Le. average of 5 annual returns]. =AVERAGE(range of data). B. Geometric average (mean) return and compare the results. Use the below formula: a. geometric average: =SUMPRODUCT(GEOMEAN(D3:D8+1))-1 C. Compare B and C results and comment the difference. D. Calculate Variance and Standard Deviation(SD): =STDEV.S(range) [Use annual returns] E. Calculate correlation matrix for all stocks including T-bill, and S&P 500.F. Calculate Covariance matrix for each pair of stocks. [note: Use Data analysis to calculate correlation and covariance] [use annual returns] G. By looking at the correlation matrix (only common stock correlation), which pair of common stocks would you expect to have the greatest diversification effect. Read lecture notes to understand diversification effect in relation with correlation coefficient. H. Write all of the above results at one place in table format before you proceed to the next questions. Should include: Part A-F
Step by Step Solution
There are 3 Steps involved in it

Get step-by-step solutions from verified subject matter experts