

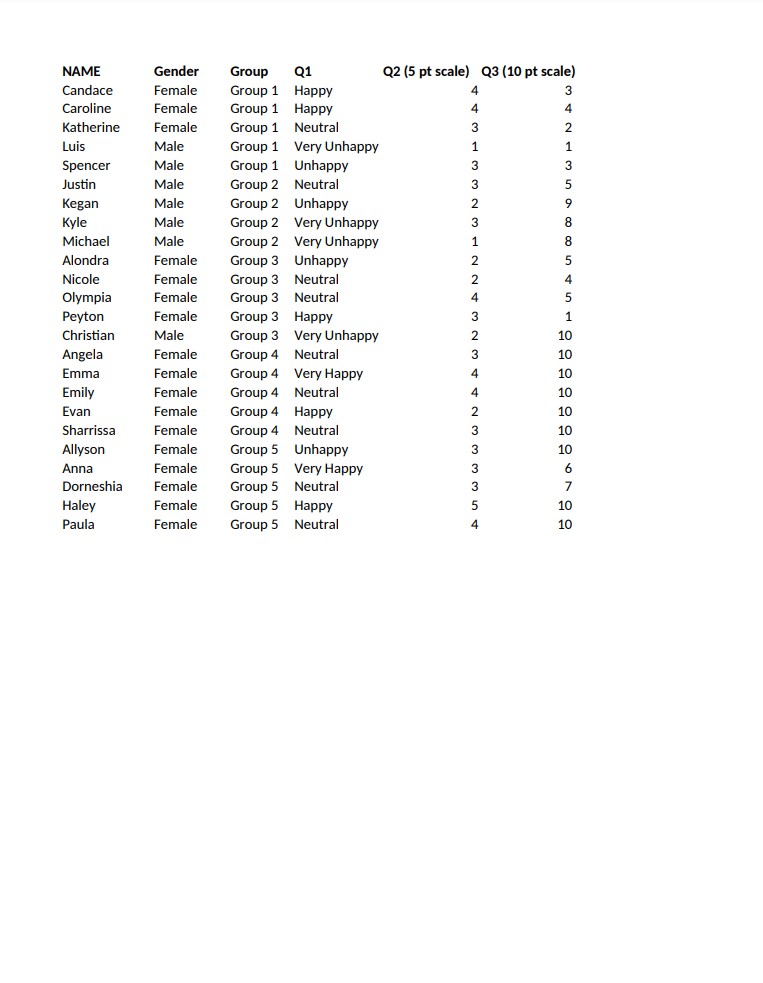
Question: This question is for Marketing Research course. Assignment: 1. Coding: Assign proper number to Q1 2. Use excel functions to calculate summary statistics of Q1
This question is for Marketing Research course.
Assignment:
1. Coding: Assign proper number to Q1
2. Use excel functions to calculate summary statistics of Q1 (average, stdev, var, median, mode, max, min)
3. (new sheet) Use "Data Analysis -> Descriptive statistics" to create summary statistics table for Q3
4. (new sheet) Use "Data Analysis -> Histogram" to create a frequency table AND histogram for Q2
5. Create histogram chart for Q2 (based on assignment 4) FYI, How to add Data Analysis https://support.microsoft.com/en-us/office/load-the-analysis-toolpak-in-excel-6a63e598-cd6d-42e3-9317-6b40ba1a66b4
Step by Step Solution
There are 3 Steps involved in it
1 Expert Approved Answer
Step: 1 Unlock

Question Has Been Solved by an Expert!
Get step-by-step solutions from verified subject matter experts
Step: 2 Unlock
Step: 3 Unlock