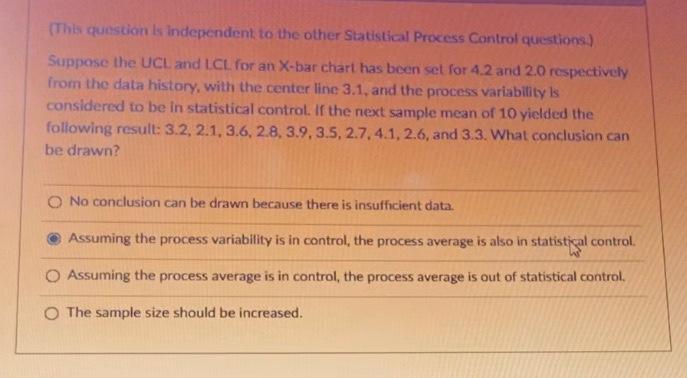
Question: (This question is independent to the other Statistical Process Con(rof questions) Suppose the UCL and LCL for an X-bar chart has been set for 4.2

(This question is independent to the other
(This question is independent to the other Statistical Process Con(rof questions) Suppose the UCL and LCL for an X-bar chart has been set for 4.2 and 2.0 respectively from the data history, with the center line 3.1, and the process variability is considered to be in statistical control. If the next sample mean of 10 yielded the following result: 3.2,2.1,3.6,2.8,3.9,3.5,2.7,4.1,2.6, and 3.3. What conclusion can be drawn? No conclusion can be drawn because there is insufficient data. Assuming the process variability is in control, the process average is also in statistical control. Assuming the process average is in control, the process average is out of statistical control. The sample size should be increased

Step by Step Solution

There are 3 Steps involved in it

1 Expert Approved Answer
Step: 1 Unlock blur-text-image
Question Has Been Solved by an Expert!

Get step-by-step solutions from verified subject matter experts

Step: 2 Unlock
Step: 3 Unlock

Students Have Also Explored These Related General Management Questions!