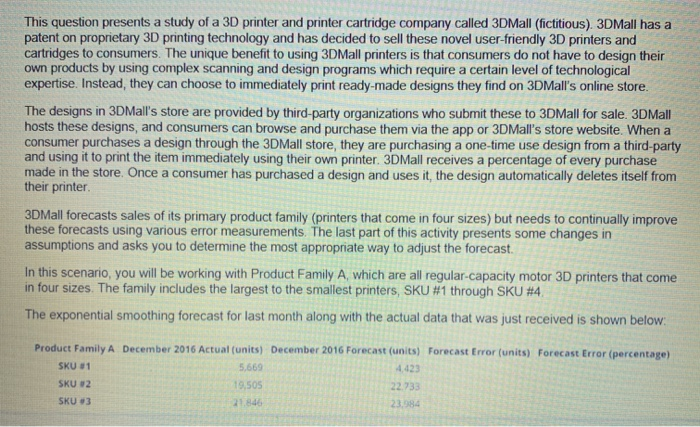
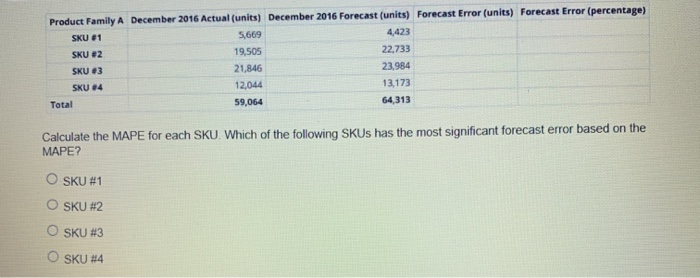
Question: This question presents a study of a 3D printer and printer cartridge company called 3DMall (fictitious). 3DMall has a patent on proprietary 3D printing technology

This question presents a study of a 3D printer
This question presents a study of a 3D printer and printer cartridge company called 3DMall (fictitious). 3DMall has a patent on proprietary 3D printing technology and has decided to sell these novel user-friendly 3D printers and cartridges to consumers. The unique benefit to using 3D Mall printers is that consumers do not have to design their own products by using complex scanning and design programs which require a certain level of technological expertise. Instead, they can choose to immediately print ready-made designs they find on 3DMall's online store. The designs in 3DMall's store are provided by third-party organizations who submit these to 3DMall for sale. 3D Mall hosts these designs, and consumers can browse and purchase them via the app or 3DMall's store website. When a consumer purchases a design through the 3DMall store, they are purchasing a one-time use design from a third-party and using it to print the item immediately using their own printer 3DMall receives a percentage of every purchase made in the store. Once a consumer has purchased a design and uses it, the design automatically deletes itself from their printer 3DMall forecasts sales of its primary product family (printers that come in four sizes) but needs to continually improve these forecasts using various error measurements. The last part of this activity presents some changes in assumptions and asks you to determine the most appropriate way to adjust the forecast. In this scenario, you will be working with Product Family A, which are all regular-capacity motor 3D printers that come in four sizes. The family includes the largest to the smallest printers, SKU #1 through SKU #4 The exponential smoothing forecast for last month along with the actual data that was just received is shown below. Product Family A December 2016 Actual (units) December 2016 Forecast (units) Forecast Error (units) Forecast Error (percentage) SKU 81 SKU 2 SKU :3 SO Product Family A December 2016 Actual units) December 2016 Forecast (units) Forecast Error (units) Forecast Error (percentage) SKU 81 5,669 4,423 SKU #2 19,505 22,733 SKU 63 21.846 23,984 SKU 24 12,044 13,173 Total 59,064 64,313 Calculate the MAPE for each SKU. Which of the following SKUs has the most significant forecast error based on the MAPE? OSKU #1 O SKU #2 OSKU #3 O SKU #4

Step by Step Solution

There are 3 Steps involved in it

1 Expert Approved Answer
Step: 1 Unlock blur-text-image
Question Has Been Solved by an Expert!

Get step-by-step solutions from verified subject matter experts

Step: 2 Unlock
Step: 3 Unlock

Students Have Also Explored These Related General Management Questions!