

Question: This question refers to dataset 7.16. a. Given the Time Series Plot, ACF Plot, Partial ACF Plot of original series (Figure 1 & Figure 2),
This question refers to dataset 7.16. a. Given the Time Series Plot, ACF Plot, Partial ACF Plot of original series (Figure 1 & Figure 2), conclude whether this dataset is stationary or not? (5 marks) b. Given the ACF Plot and Partial ACF Plot of the seasonal differenced series (Figure 3 & Figure 4), suggest at least 2 candidate ARIMA(p,d,q)(P,D,Q)(12) models for this time series and briefly explain why.
c. Use Minitab to find residual mean squares (MS) of the candidate model(s), then conclude on the best fit ARIMA model. (5 marks) d. Use Minitab to find set of coefficients of the best fit ARIMA(p,d,q)(P,D,Q)(12) model, then write the estimated equation of this model. (5 marks)
e. Use the above best fit ARIMA model to find the forecast value for t=91 (Residuals can be concluded from Minitab's output). (5 marks)
| Month, t | Observation, Y[t] |
| 1 | 101 |
| 2 | 84 |
| 3 | 54 |
| 4 | 39 |
| 5 | 26 |
| 6 | 40 |
| 7 | 99 |
| 8 | 148 |
| 9 | 147 |
| 10 | 134 |
| 11 | 106 |
| 12 | 83 |
| 13 | 76 |
| 14 | 63 |
| 15 | 57 |
| 16 | 37 |
| 17 | 32 |
| 18 | 22 |
| 19 | 20 |
| 20 | 23 |
| 21 | 30 |
| 22 | 50 |
| 23 | 61 |
| 24 | 59 |
| 25 | 64 |
| 26 | 58 |
| 27 | 44 |
| 28 | 26 |
| 29 | 24 |
| 30 | 18 |
| 31 | 16 |
| 32 | 17 |
| 33 | 21 |
| 34 | 28 |
| 35 | 30 |
| 36 | 51 |
| 37 | 62 |
| 38 | 57 |
| 39 | 46 |
| 40 | 40 |
| 41 | 32 |
| 42 | 23 |
| 43 | 20 |
| 44 | 18 |
| 45 | 24 |
| 46 | 33 |
| 47 | 52 |
| 48 | 66 |
| 49 | 78 |
| 50 | 83 |
| 51 | 87 |
| 52 | 64 |
| 53 | 44 |
| 54 | 24 |
| 55 | 29 |
| 56 | 73 |
| 57 | 138 |
| 58 | 154 |
| 59 | 119 |
| 60 | 102 |
| 61 | 79 |
| 62 | 53 |
| 63 | 40 |
| 64 | 27 |
| 65 | 31 |
| 66 | 56 |
| 67 | 78 |
| 68 | 114 |
| 69 | 140 |
| 70 | 112 |
| 71 | 82 |
| 72 | 80 |
| 73 | 70 |
| 74 | 55 |
| 75 | 37 |
| 76 | 23 |
| 77 | 20 |
| 78 | 39 |
| 79 | 71 |
| 80 | 110 |
| 81 | 112 |
| 82 | 93 |
| 83 | 75 |
| 84 | 60 |
| 85 | 63 |
| 86 | 46 |
| 87 | 32 |
| 88 | 23 |
| 89 | 53 |
| 90 | 90 |
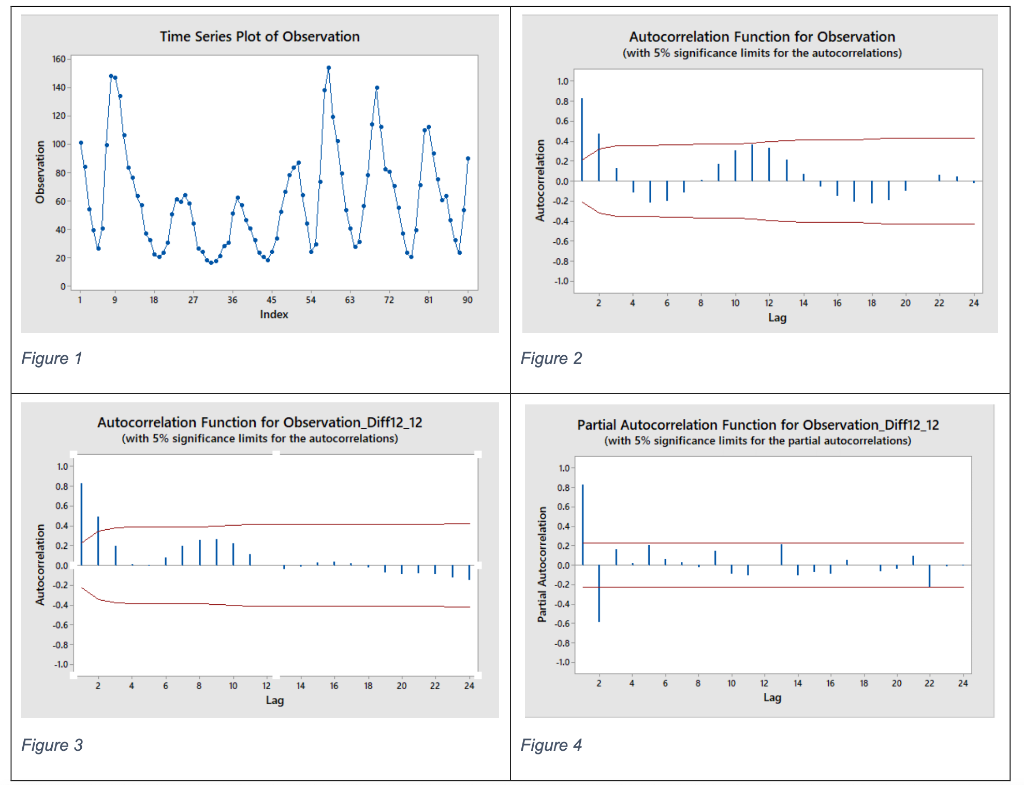
Time Series Plot of Observation Autocorrelation Function for Observation (with 5% significance limits for the autocorrelations) 160 1.0 140 0.8 120 0.6 100 0.4 0.2 Observation 80 1111 Autocorrelation 47 0.0 60 -0.2 N -0.4 40 -0.6 20 -0.8 -1.0 0 1 9 9 18 27 36 54 63 72 81 90 2 4 45 Index 6 8 10 14 16 18 20 22 24 12 Lag Figure 1 Figure 2 Autocorrelation Function for Observation_Diff12_12 (with 5% significance limits for the autocorrelations) Partial Autocorrelation Function for Observation_Diff12_12 (with 5% significance limits for the partial autocorrelations) 1.0 1.0 0.8 0.8 0.6 0.6 0.4 0.4 0.2 0.2 Autocorrelation 0.0 Partial Autocorrelation 0.0 -0.2 -0.2 -0.4 -0.4 -0.6 -0.6 -0.8 -0.8 -1.0 -1.0 2 4 6 8 10 14 16 18 20 22 4 24 2 6 8 10 14 16 18 20 22 24 12 Lag 12 Lag Figure 3 Figure 4
Step by Step Solution
There are 3 Steps involved in it

Get step-by-step solutions from verified subject matter experts