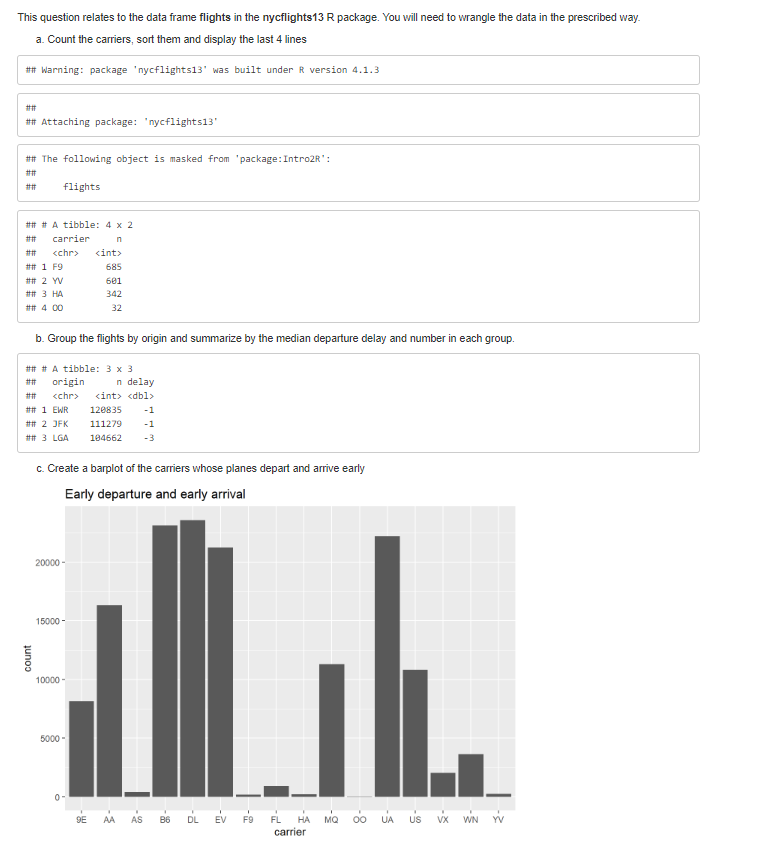
Question: This question relates to the data frame flights in the nycflights13 R package. You will need to wrangle the data in the prescribed way. a.

This question relates to the data frame flightsThis question relates to the data frame flightsThis question relates to the data frame flights
This question relates to the data frame flights in the nycflights13 R package. You will need to wrangle the data in the prescribed way. a. Count the carriers, sort them and display the last 4 lines #it Warning: package 'nycflights13" was built under R version 4.1.3 # IF ## Attaching package: "nycflights13" Hit The following object is masked from 'package: Intro2R': #iF flights #if # A tibble: 4 x 2 carrier #it ## 1 F9 685 #it 2 YV 691 #iT 3 HA 342 # 4 00 32 b. Group the flights by origin and summarize by the median departure delay and number in each group. #it # A tibble: 3 x 3 origin n delay # 1 EWR 120835 -1 ## 2 JFK 111279 ## 3 LGA 194662 c. Create a barplot of the carriers whose planes depart and arrive early Early departure and early arrival 20000 - 15000 - count 10000 - 5000 - AA AS 86 DL EV F9 FL HA MO OO UA US VX WN carrierd. Create the following data frame where the proportion of flights with short delay at departure is defined by when a flight departure delay is = 180 min. WW U A tibble: 365 x 5 year month day prop_delayed number_long_delay NW 1 2913 1 0.874 2 9. 848 0. 866 3 0. 881 8.93 NW 6 2013 6 3.899 WW 7 2013 7 3.91 WNKNOWH 8 2913 0. 94 WW 9 2013 9 B.95 WW 10 2013 8.946 WW # 1 355 more rows e. Make the following barplot after examining the code. Note that both if_else() and case_when() require compatible types in the output. Note also, the plot has a particular order to the levels of situation! df X mutate( situation = case_when( is. na (arr_delay) "cancelled" arr_delay 11 late WW 2 20 late WWI 3 33 late WW 4 -18 early -25 early 12 late Dr Stewart's bar-plot for the situation of flights 90000 - situation cancelled 60090 very early count early on time very late 30000- cancelled very early early on time late very late situationf. Make a histogram (bins = 40) of the air_time variable for all flights with origin JFK or EWR. #1 Warning: Removed 5908 rows containing non-finite values (" stat_bin()"). Dr Stewart's histogram of air time 20000 - 15000 - origin EWR count 10000 JFK 5000 - 200 400 600 air_time Question 3 Using the babynames data set in the R package babynames find all the names that repeat the first three letters at the end of their name in reverse order with one vowel in between the two groups. That is (ABC)(VOWEL)(CBA). The code you produce must search for the appropriate regular expression. it # A tibble: 6 x 1 name ## 1 habibah ## 2 habibah if# 3 habibal it 4 habibah i# 5 habibah i# 6 habibah Question 4 Find the names of babies that have a sequence of two letters then immediately 2 vowels and end with the same sequence, that is the name contains for example LETTERS(AB)(AE)LETTERS(AB)(AE). Remember - I want you to verify the result by searching all names for the appropriate regular expression. The code will need to be correct. *# # A tibble: 1 x 1 name 7# 1 arielmarie

Step by Step Solution

There are 3 Steps involved in it

1 Expert Approved Answer
Step: 1 Unlock blur-text-image
Question Has Been Solved by an Expert!

Get step-by-step solutions from verified subject matter experts

Step: 2 Unlock
Step: 3 Unlock

Students Have Also Explored These Related Mathematics Questions!