

Question: This question requires knowledge on Data Analytics . Please show clear and detailed explanations. Someone, please help to assist. I had to repost as the
This question requires knowledge on Data Analytics. Please show clear and detailed explanations.
Someone, please help to assist. I had to repost as the previous answers for parts (b) and (c) were not answered appropriately.
For details on description and predictive data mining to answer (b) and (c), please refer to the screenshots below.
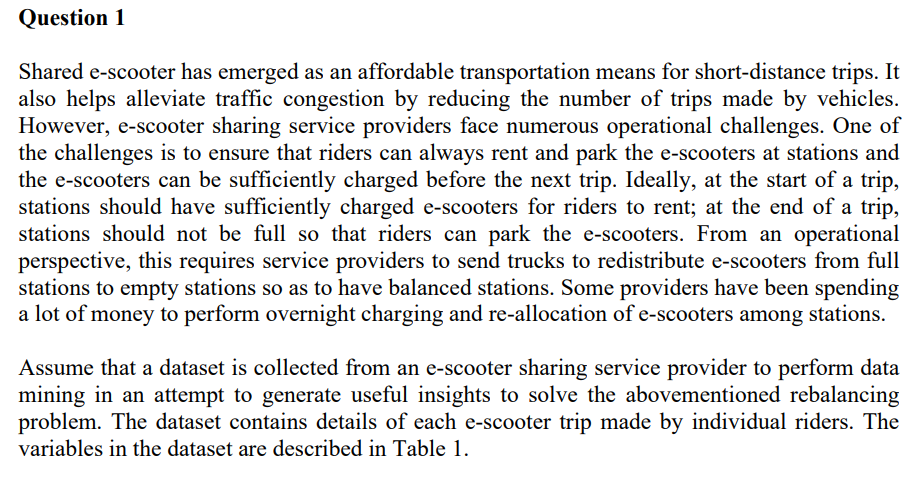
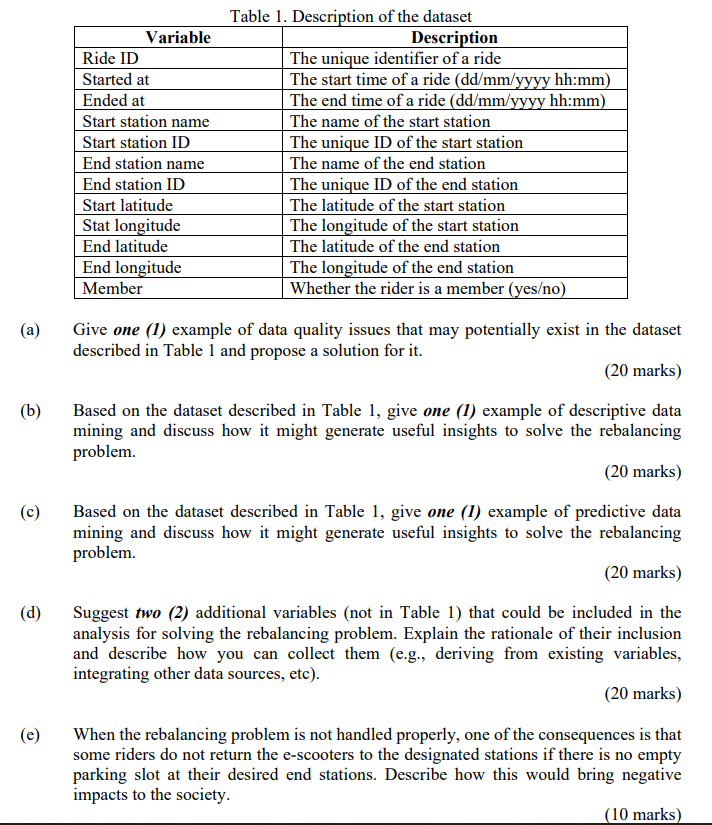
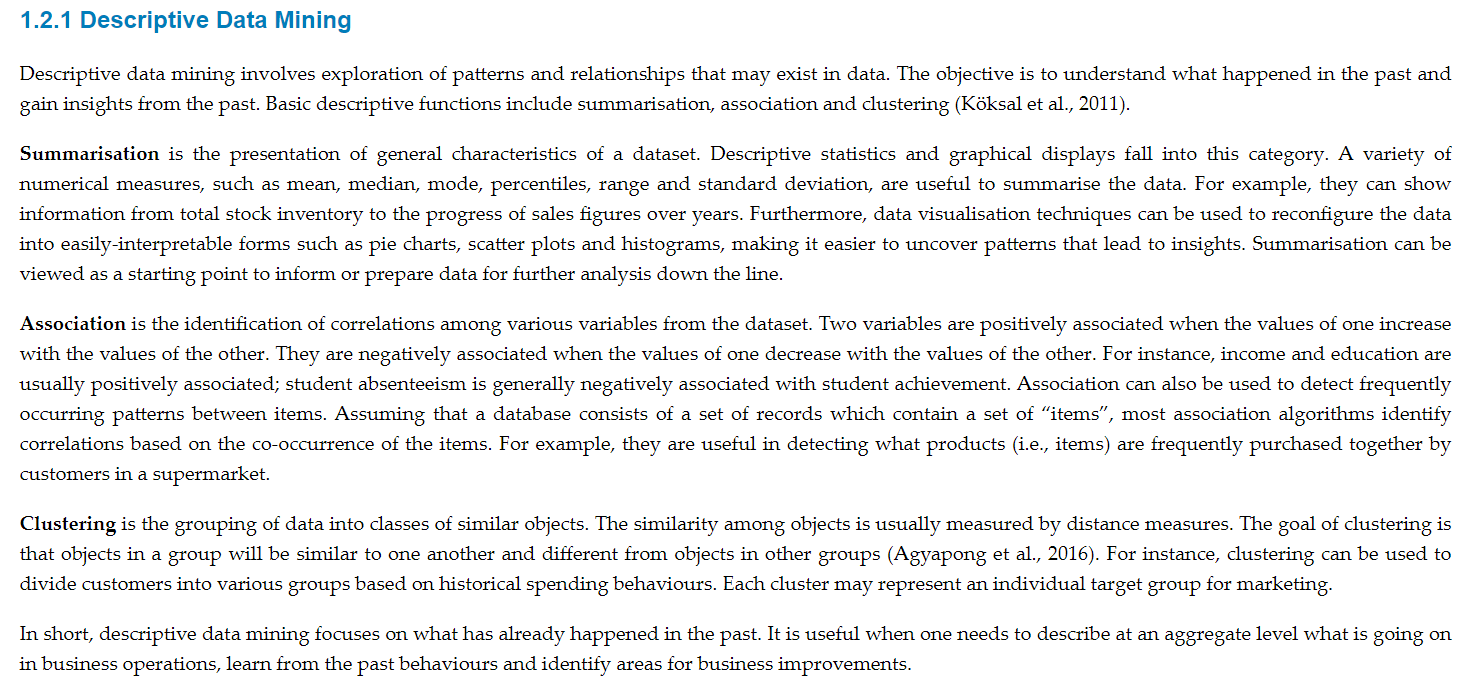
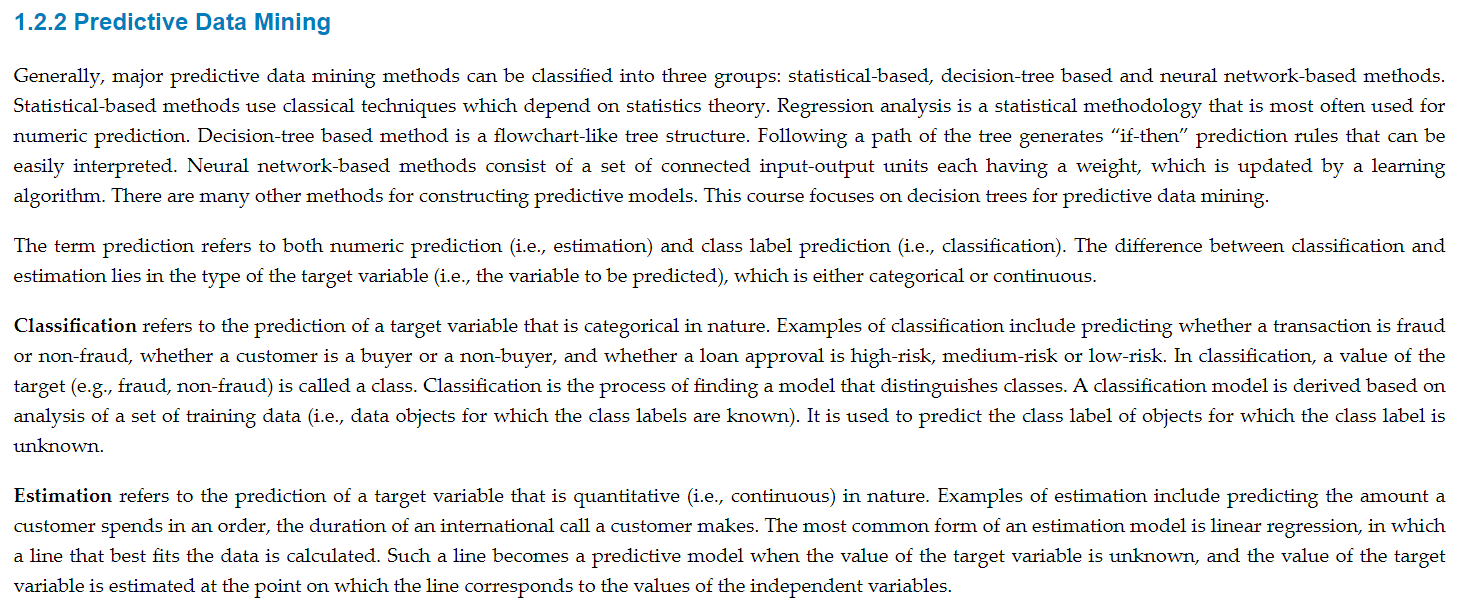
Shared e-scooter has emerged as an affordable transportation means for short-distance trips. It also helps alleviate traffic congestion by reducing the number of trips made by vehicles. However, e-scooter sharing service providers face numerous operational challenges. One of the challenges is to ensure that riders can always rent and park the e-scooters at stations and the e-scooters can be sufficiently charged before the next trip. Ideally, at the start of a trip, stations should have sufficiently charged e-scooters for riders to rent; at the end of a trip, stations should not be full so that riders can park the e-scooters. From an operational perspective, this requires service providers to send trucks to redistribute e-scooters from full stations to empty stations so as to have balanced stations. Some providers have been spending a lot of money to perform overnight charging and re-allocation of e-scooters among stations. Assume that a dataset is collected from an e-scooter sharing service provider to perform data mining in an attempt to generate useful insights to solve the abovementioned rebalancing problem. The dataset contains details of each e-scooter trip made by individual riders. The variables in the dataset are described in Table 1. a) Give one (1) example of data quality issues that may potentially exist in the dataset described in Table 1 and propose a solution for it. (20 marks) Based on the dataset described in Table 1, give one (1) example of descriptive data mining and discuss how it might generate useful insights to solve the rebalancing problem. (20 marks) Based on the dataset described in Table 1, give one (1) example of predictive data mining and discuss how it might generate useful insights to solve the rebalancing problem. (20 marks) 1) Suggest two (2) additional variables (not in Table 1) that could be included in the analysis for solving the rebalancing problem. Explain the rationale of their inclusion and describe how you can collect them (e.g., deriving from existing variables, integrating other data sources, etc). (20 marks) When the rebalancing problem is not handled properly, one of the consequences is that some riders do not return the e-scooters to the designated stations if there is no empty parking slot at their desired end stations. Describe how this would bring negative impacts to the society. Descriptive data mining involves exploration of patterns and relationships that may exist in data. The objective is to understand what happened in the past and gain insights from the past. Basic descriptive functions include summarisation, association and clustering (Kksal et al., 2011). Summarisation is the presentation of general characteristics of a dataset. Descriptive statistics and graphical displays fall into this category. A variety of numerical measures, such as mean, median, mode, percentiles, range and standard deviation, are useful to summarise the data. For example, they can show information from total stock inventory to the progress of sales figures over years. Furthermore, data visualisation techniques can be used to reconfigure the data into easily-interpretable forms such as pie charts, scatter plots and histograms, making it easier to uncover patterns that lead to insights. Summarisation can be viewed as a starting point to inform or prepare data for further analysis down the line. Association is the identification of correlations among various variables from the dataset. Two variables are positively associated when the values of increase with the values of the other. They are negatively associated when the values of one decrease with the values of the other. For instance, income and educion are usually positively associated; student absenteeism is generally negatively associated with student achievement. Association can also be used to detect frequently occurring patterns between items. Assuming that a database consists of a set of records which contain a set of "items", most association algorithms identify correlations based on the co-occurrence of the items. For example, they are useful in detecting what products (i.e., items) are frequently purchased together by customers in a supermarket. Clustering is the grouping of data into classes of similar objects. The similarity among objects is usually measured by distance measures. The goal of clustering is that objects in a group will be similar to one another and different from objects in other groups (Agyapong et al., 2016). For instance, clustering can be used to divide customers into various groups based on historical spending behaviours. Each cluster may represent an individual target group for marketing. In short, descriptive data mining focuses on what has already happened in the past. It is useful when one needs to describe at an aggregate level what is going on in business operations, learn from the past behaviours and identify areas for business improvements. Generally, major predictive data mining methods can be classified into three groups: statistical-based, decision-tree based and neural network-based methods. Statistical-based methods use classical techniques which depend on statistics theory. Regression analysis is a statistical methodology that is most often used for numeric prediction. Decision-tree based method is a flowchart-like tree structure. Following a path of the tree generates "if-then" prediction rules that can be easily interpreted. Neural network-based methods consist of a set of connected input-output units each having a weight, which is updated by a learning algorithm. There are many other methods for constructing predictive models. This course focuses on decision trees for predictive data mining. The term prediction refers to both numeric prediction (i.e., estimation) and class label prediction (i.e., classification). The difference between classification and estimation lies in the type of the target variable (i.e., the variable to be predicted), which is either categorical or continuous. Classification refers to the prediction of a target variable that is categorical in nature. Examples of classification include predicting whether a transaction is fraud or non-fraud, whether a customer is a buyer or a non-buyer, and whether a loan approval is high-risk, medium-risk or low-risk. In classification, a value of the target (e.g., fraud, non-fraud) is called a class. Classification is the process of finding a model that distinguishes classes. A classification model is derived based on analysis of a set of training data (i.e., data objects for which the class labels are known). It is used to predict the class label of objects for which the class label is unknown. Estimation refers to the prediction of a target variable that is quantitative (i.e., continuous) in nature. Examples of estimation include predicting the amount a customer spends in an order, the duration of an international call a customer makes. The most common form of an estimation model is linear regrion variable is estimated at the point on which the line corresponds to the values of the independent variables
Step by Step Solution
There are 3 Steps involved in it

Get step-by-step solutions from verified subject matter experts