

Question: This question requires Python coding. 1. Angles between high-dimensional random vectors. The angle between two vectors, X,Y ER, is given by X y 0 =
This question requires Python coding.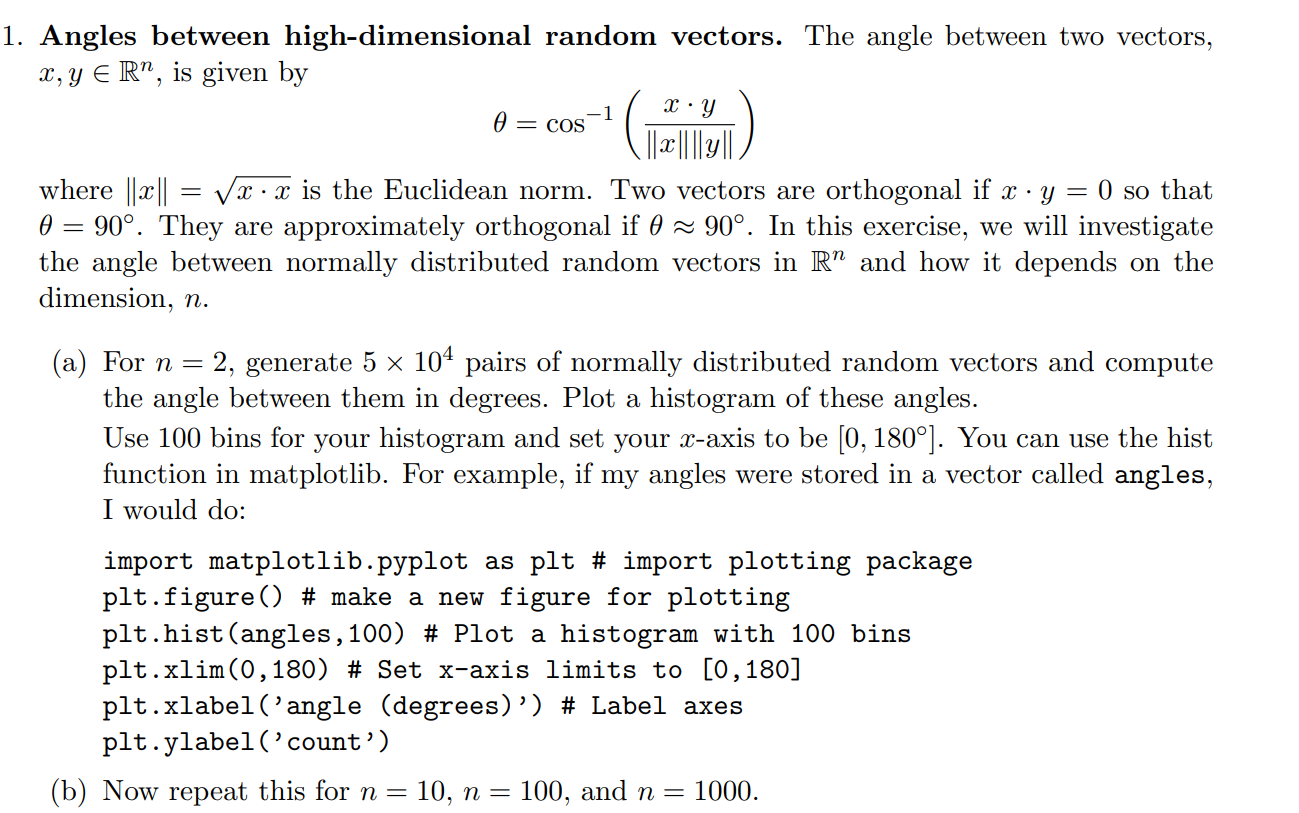
1. Angles between high-dimensional random vectors. The angle between two vectors, X,Y ER, is given by X y 0 = cos-1/ * ( ||2||||y|| where || X || = Vx x is the Euclidean norm. Two vectors are orthogonal if x y = 0 so that 0 = 90. They are approximately orthogonal if 0 = 90. In this exercise, we will investigate the angle between normally distributed random vectors in R and how it depends on the dimension, n. (a) For n = 2, generate 5 x 10⁴ pairs of normally distributed random vectors and compute the angle between them in degrees. Plot a histogram of these angles. Use 100 bins for your histogram and set your x-axis to be [0, 180). You can use the hist function in matplotlib. For example, if my angles were stored in a vector called angles, I would do: import matplotlib.pyplot as plt # import plotting package plt.figure() # make a new figure for plotting plt.hist(angles, 100) # Plot a histogram with 100 bins plt.xlim (0,180) # Set x-axis limits to [0,180] plt.xlabel('angle (degrees)') # Label axes plt.ylabel('count') (b) Now repeat this for n = 10, n = 100, and n = 1000. 1. Angles between high-dimensional random vectors. The angle between two vectors, X,Y ER, is given by X y 0 = cos-1/ * ( ||2||||y|| where || X || = Vx x is the Euclidean norm. Two vectors are orthogonal if x y = 0 so that 0 = 90. They are approximately orthogonal if 0 = 90. In this exercise, we will investigate the angle between normally distributed random vectors in R and how it depends on the dimension, n. (a) For n = 2, generate 5 x 10⁴ pairs of normally distributed random vectors and compute the angle between them in degrees. Plot a histogram of these angles. Use 100 bins for your histogram and set your x-axis to be [0, 180). You can use the hist function in matplotlib. For example, if my angles were stored in a vector called angles, I would do: import matplotlib.pyplot as plt # import plotting package plt.figure() # make a new figure for plotting plt.hist(angles, 100) # Plot a histogram with 100 bins plt.xlim (0,180) # Set x-axis limits to [0,180] plt.xlabel('angle (degrees)') # Label axes plt.ylabel('count') (b) Now repeat this for n = 10, n = 100, and n = 1000
Step by Step Solution
There are 3 Steps involved in it

Get step-by-step solutions from verified subject matter experts