

Question: This question requires you to use Data4 file. Run a simple linear regression using Best Buy revenue (measured in million$) as the dependent variable and
This question requires you to use Data4 file.
- Run a simple linear regression using Best Buy revenue (measured in million$) as the dependent variable and GDP (measured in million$) as the independent variable. Report the estimated regression line.
- Use the last observation in the dataset for GDP to predict the expected revenue for Best Buy. State the correct unit of your prediction.
- Test at the 10% significance level if revenue and GDP are positively and significantly related. State the hypothesis, criteria used, decision and conclusion.
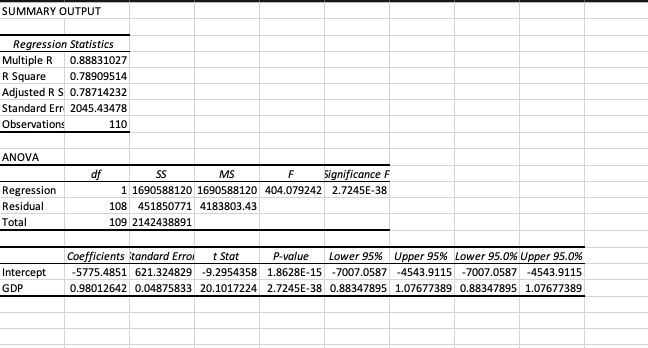
SUMMARY OUTPUT Regression Statistics Multiple R 0.88831027 R Square 0.78909514 Adjusted R 5 0.78714232 Standard Err 2045.43478 Observations 110 ANOVA df SS MS F Significance F Regression 1 1690588120 1690588120 404.079242 2.7245E-38 Residual 108 451850771 4183803.43 Total 109 2142438891 Coefficients tandard Errol t Stat P-value Lower 95% Upper 95% Lower 95.0% Upper 95.0% Intercept -5775.4851 621.324829 -9.2954358 1.8628E-15 -7007.0587 -4543.9115 -7007.0587 -4543.9115 GDP 0.98012642 0.04875833 20.1017224 2.7245E-38 0.88347895 1.07677389 0.88347895 1.07677389
Step by Step Solution
There are 3 Steps involved in it
1 Expert Approved Answer
Step: 1 Unlock

Question Has Been Solved by an Expert!
Get step-by-step solutions from verified subject matter experts
Step: 2 Unlock
Step: 3 Unlock