

Question: This question s Data visualization course.Please explain in detail.We have data about trends in faculty employment status. There are two different visualizations as follows: 1.
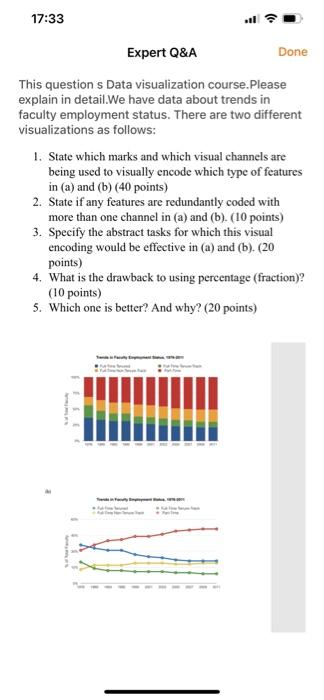
This question s Data visualization course.Please explain in detail.We have data about trends in faculty employment status. There are two different visualizations as follows: 1. State which marks and which visual channels are being used to visually encode which type of features in (a) and (b) (40 points) 2. State if any features are redundantly coded with more than one channel in (a) and (b). (10 points) 3. Specify the abstract tasks for which this visual encoding would be effective in (a) and (b). ( 20 points) 4. What is the drawback to using percentage (fraction)? (10 points) 5. Which one is better? And why? ( 20 points)
Step by Step Solution
There are 3 Steps involved in it

Get step-by-step solutions from verified subject matter experts