Question: this question using the graph that starts with 1 day 5 defectives a) The upper and lower 3-sigma control chart limits are: UCLP = 110

this question using the graph that starts with 1 day 5 defectives this question using the graph that starts with 1
this question using the graph that starts with 1
a) The upper and lower 3-sigma control chart limits are: UCLP = 110 (enter your response as a number between 0 and 1, rounded to three decimal places). LCL = 0 (enter your response as a number between 0 and 1, rounded to three decimal places). b) Given the limits in part a, is the process in control for the following days as shown in the table below? Day Number of Defects In-Control 11 13 NO 12 7 YES 13 16 NO Question is complete. Tap on the red indicators to see incorrect answers, The results of inspection of DNA samples taken over the past 10 days are given below. Sample size is 100 2 Defectives Day 1 5 3 7 4 9 5 5 6 6 7 0 0 10 10 1 7 7 a) The upper and lower 3-sigma control chart limits are: UCL (enter your responso as a number between 0 and 1, rounded to three decimal placea)

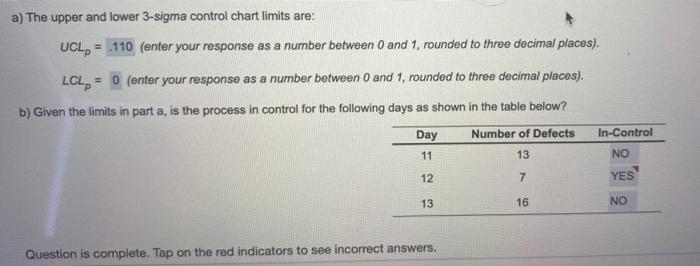
Step by Step Solution

There are 3 Steps involved in it

1 Expert Approved Answer
Step: 1 Unlock blur-text-image
Question Has Been Solved by an Expert!

Get step-by-step solutions from verified subject matter experts

Step: 2 Unlock
Step: 3 Unlock

Students Have Also Explored These Related General Management Questions!