

Question: This quiz: 15 point(s) E Quiz: Chapter 6 Quiz Question 4 of 15 possible This question: 1 Submit quiz point(s) possible According to a recent
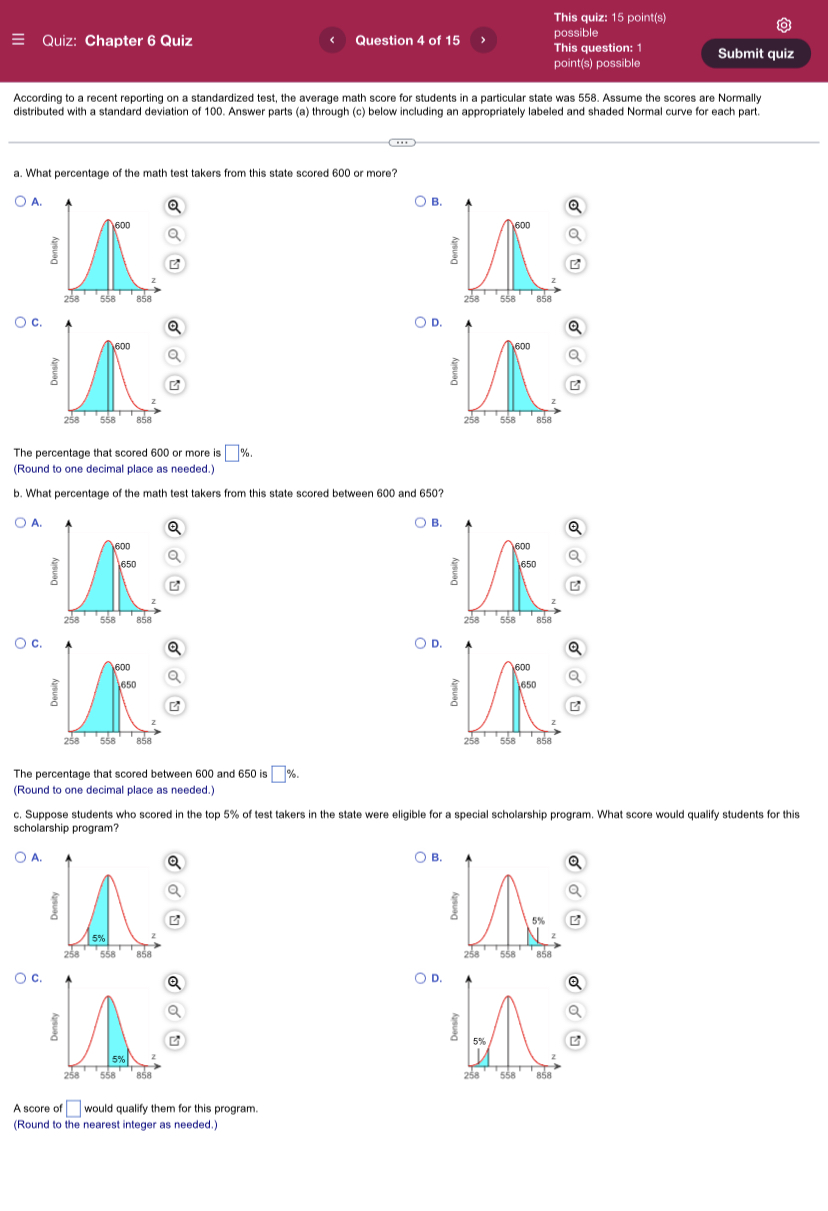


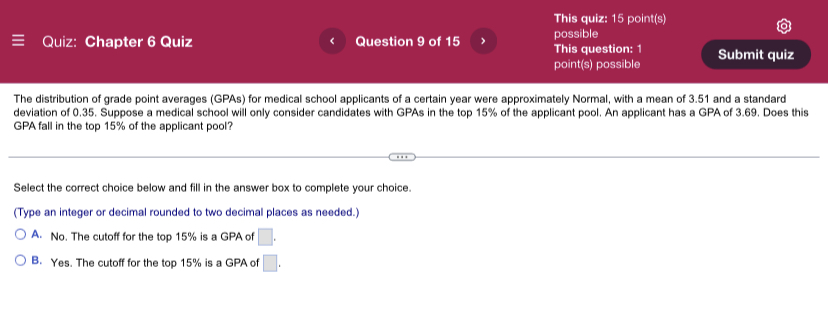
This quiz: 15 point(s) E Quiz: Chapter 6 Quiz Question 4 of 15 possible This question: 1 Submit quiz point(s) possible According to a recent reporting on a standardized test, the average math score for students in a particular state was 558. Assume the scores are Normally distributed with a standard deviation of 100. Answer parts (a) through (c) below including an appropriately labeled and shaded Normal curve for each part. a. What percentage of the math test takers from this state scored 600 or more? O A. Q OB. Density Density 258 558 858 258 558 858 O c. O D. 600 1600 O Density Density 558 258 558 The percentage that scored 600 or more is%. (Round to one decimal place as needed.) b. What percentage of the math test takers from this state scored between 600 and 650? O A. O B. 600 Q Density Density 258 558 858 258 558 858 O C. OD. BOL Q Q 1650 Density Density 258 558 258 558 858 The percentage that scored between 600 and 650 is%. (Round to one decimal place as needed.) c. Suppose students who scored in the top 5% of test takers in the state were eligible for a special scholarship program. What score would qualify students for this scholarship program? O A. O B. Q Density 5% 258 558 858 258 558 858 O C. O D. A Q Density Density 57 258 558 858 258 558 858 A score of would qualify them for this program. (Round to the nearest integer as needed.)This quiz: 15 point(s) = Quiz: Chapter 6 Quiz
Step by Step Solution
There are 3 Steps involved in it

Get step-by-step solutions from verified subject matter experts