

Question: This quiz: 40 point(s) possible z: Chapter 6 Question 2 of 15 This question: 3 point(s) Resume later possible Submit quiz Assume that a randomly
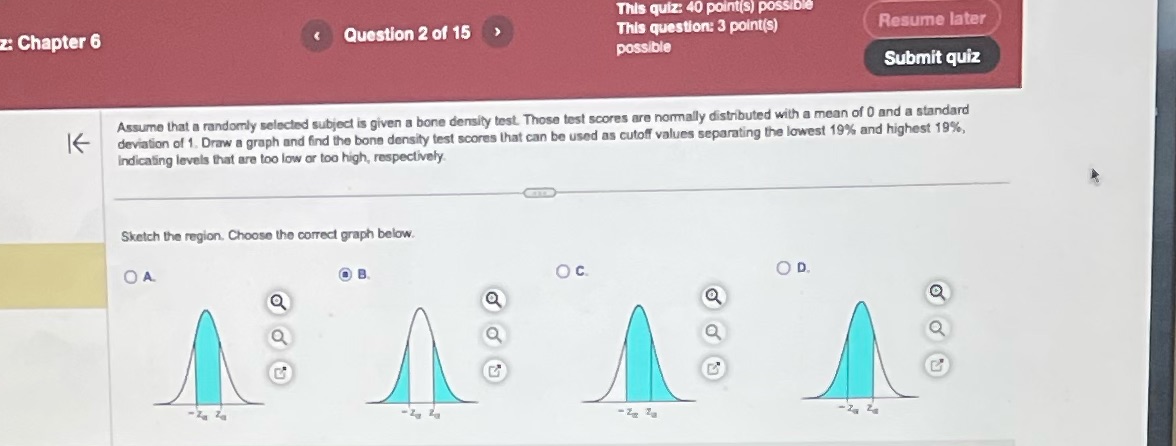
This quiz: 40 point(s) possible z: Chapter 6 Question 2 of 15 This question: 3 point(s) Resume later possible Submit quiz Assume that a randomly selected subject is given a bone density test. Those test scores are normally distributed with a mean of 0 and a standard K deviation of 1. Draw a graph and find the bone density test scores that can be used as cutoff values separating the lowest 19% and highest 19%, indicating levels that are too low or too high, respectively. Sketch the region. Choose the correct graph below. OA OB O c. OD Q - Z Z
Step by Step Solution
There are 3 Steps involved in it
1 Expert Approved Answer
Step: 1 Unlock

Question Has Been Solved by an Expert!
Get step-by-step solutions from verified subject matter experts
Step: 2 Unlock
Step: 3 Unlock