

Question: This quiz: 7 point(s) possible Quiz: Exam 5 Chapter 6 Quiz: Exam 5 Chapter 6 < Question 3 of 7 > This quiz: 7 point(s)
This quiz: 7 point(s) possible Quiz: Exam 5 Chapter 6
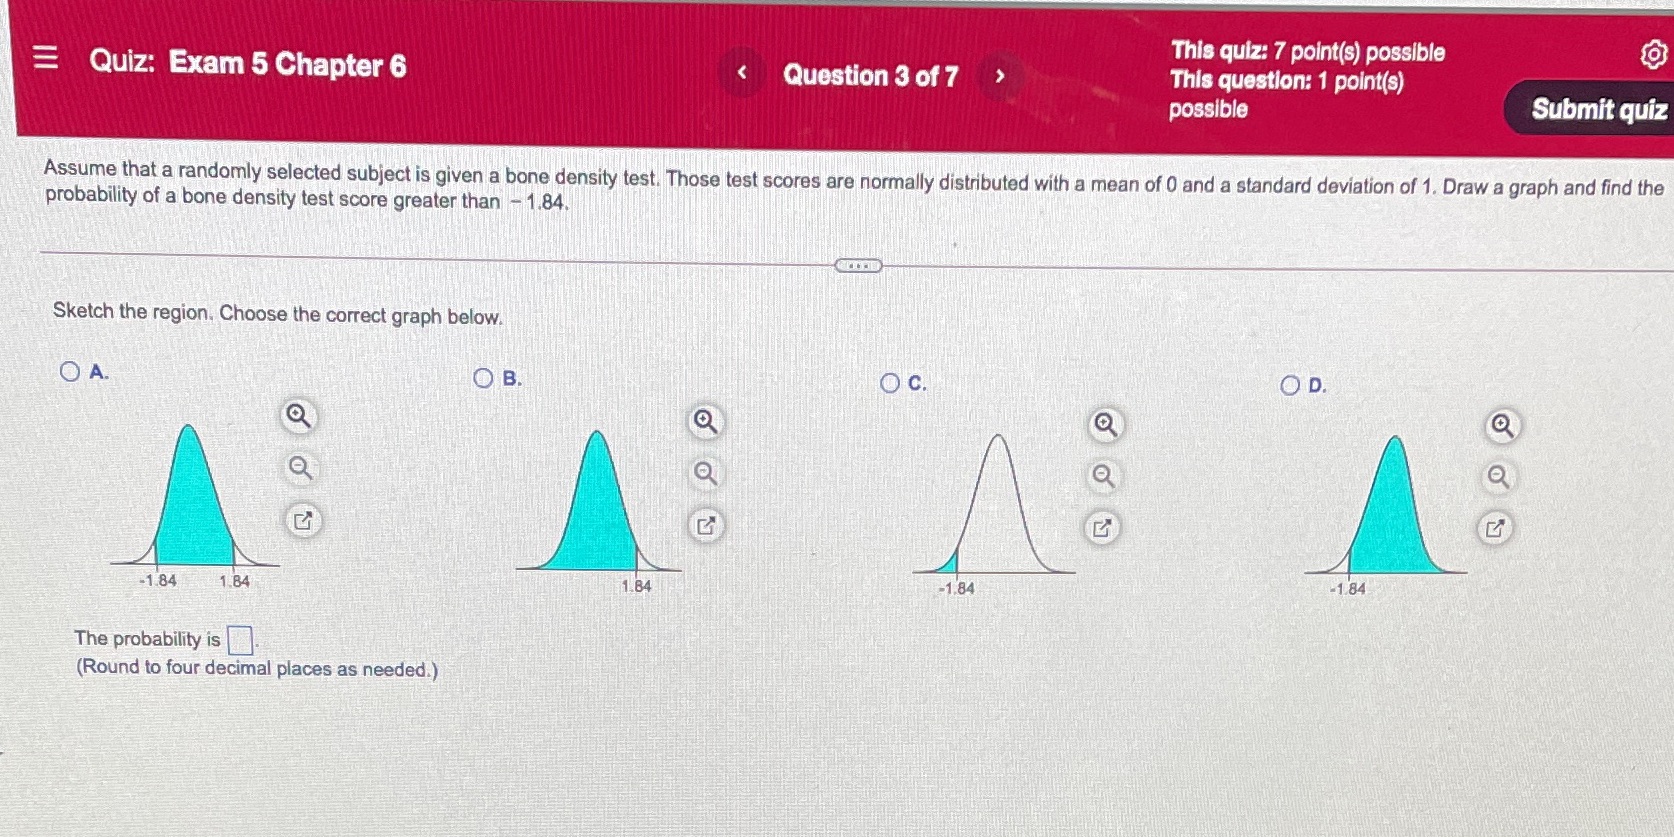
Quiz: Exam 5 Chapter 6 < Question 3 of 7 > This quiz: 7 point(s) possible This question: 1 point(s) possible Submit quiz Assume that a randomly selected subject is given a bone density test. Those test scores are normally distributed with a mean of O and a standard deviation of 1. Draw a graph and find the probability of a bone density test score greater than Sketch the region. Choose the correct graph below, -1.84 1.84 The probability is D. (Round to four decimal places as needed.)
Step by Step Solution
There are 3 Steps involved in it
1 Expert Approved Answer
Step: 1 Unlock

Question Has Been Solved by an Expert!
Get step-by-step solutions from verified subject matter experts
Step: 2 Unlock
Step: 3 Unlock