

Question: this R language, I want to Plot the function for 4 to 4, I try to call function and i set it to -4,4 and
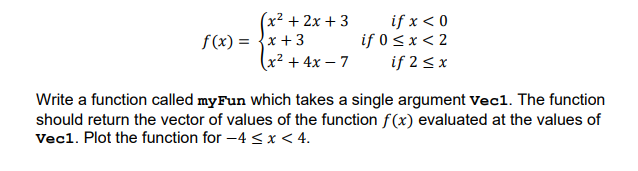
this R language, I want to Plot the function for 4 to 4, I try to call function and i set it to -4,4 and then plot yAxis and xAxis but give me an error. can you please fix it. I have provide the question above
myFun = function(Vec1){ yAxis
if(x f(x)=x2+2x+3x+3x2+4x7ifx
Step by Step Solution
There are 3 Steps involved in it
1 Expert Approved Answer
Step: 1 Unlock

Question Has Been Solved by an Expert!
Get step-by-step solutions from verified subject matter experts
Step: 2 Unlock
Step: 3 Unlock