

Question: This requires 2 .m files, one for the function, and another to call the function. (All to be done on matlab) Homework 7: Due when
This requires 2 .m files, one for the function, and another to call the function. (All to be done on matlab)
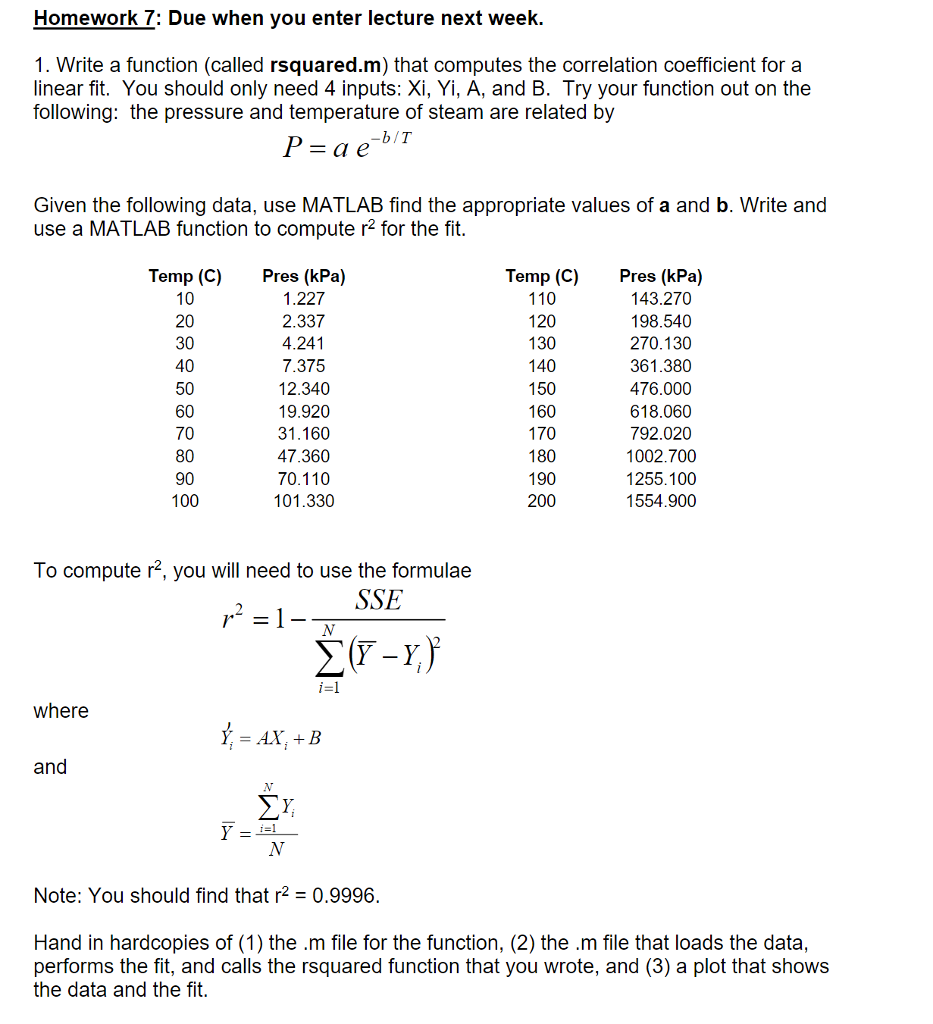
Homework 7: Due when you enter lecture next week. 1. Write a function (called rsquared.m) that computes the correlation coefficient for a linear fit. You should only need 4 inputs: Xi, Yi, A, and B. Try your function out on the following: the pressure and temperature of steam are related by b/T Given the following data, use MATLAB find the appropriate values of a and b. Write and use a MATLAB function to compute r2 for the fit. Temp (C) 20 30 40 50 60 70 80 90 100 Pres (kPa) 1.227 2.337 4.241 7.375 12.340 19.920 31.160 47.360 70.110 101.330 Temp (C) 110 120 130 140 150 160 170 180 190 200 Pres (kPa) 143.270 198.540 270.130 361.380 476.000 618.060 792.020 1002.700 1255.100 1554.900 To compute r2, you will need to use the formulae SSE i=1 where and Note: You should find that r2 0.9996. Hand in hardcopies of (1) the .m file for the function, (2) the .m file that loads the data, performs the fit, and calls the rsquared function that you wrote, and (3) a plot that shows the data and the fit Homework 7: Due when you enter lecture next week. 1. Write a function (called rsquared.m) that computes the correlation coefficient for a linear fit. You should only need 4 inputs: Xi, Yi, A, and B. Try your function out on the following: the pressure and temperature of steam are related by b/T Given the following data, use MATLAB find the appropriate values of a and b. Write and use a MATLAB function to compute r2 for the fit. Temp (C) 20 30 40 50 60 70 80 90 100 Pres (kPa) 1.227 2.337 4.241 7.375 12.340 19.920 31.160 47.360 70.110 101.330 Temp (C) 110 120 130 140 150 160 170 180 190 200 Pres (kPa) 143.270 198.540 270.130 361.380 476.000 618.060 792.020 1002.700 1255.100 1554.900 To compute r2, you will need to use the formulae SSE i=1 where and Note: You should find that r2 0.9996. Hand in hardcopies of (1) the .m file for the function, (2) the .m file that loads the data, performs the fit, and calls the rsquared function that you wrote, and (3) a plot that shows the data and the fit
Step by Step Solution
There are 3 Steps involved in it

Get step-by-step solutions from verified subject matter experts