

Question: This sample data shows how many times each person eats chocolate a week and how old they are. The distribution is normal Challenge the null
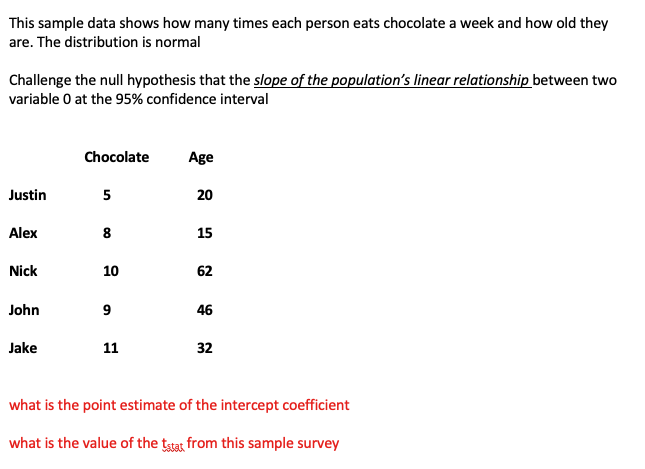
This sample data shows how many times each person eats chocolate a week and how old they are. The distribution is normal Challenge the null hypothesis that the slope of the population's linear relationship between two variable 0 at the 95% confidence interval Chocolate Age Justin 5 20 Alex 8 15 Nick 10 62 John 9 46 Jake 11 32 what is the point estimate of the intercept coefficient what is the value of the tsar from this sample survey
Step by Step Solution
There are 3 Steps involved in it
1 Expert Approved Answer
Step: 1 Unlock

Question Has Been Solved by an Expert!
Get step-by-step solutions from verified subject matter experts
Step: 2 Unlock
Step: 3 Unlock