

Question: This scatterplot shows the number of hours a student slept every night and his or her grade point average Grade Point Average 4 0 3

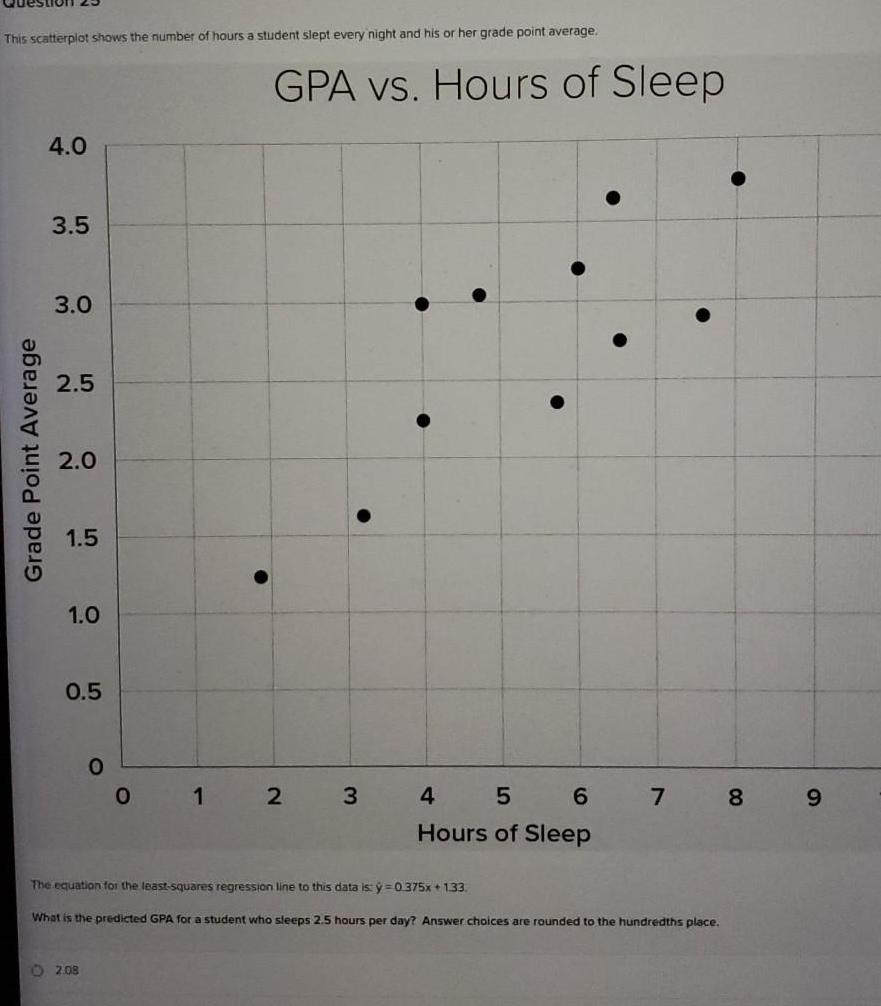
This scatterplot shows the number of hours a student slept every night and his or her grade point average Grade Point Average 4 0 3 5 3 0 2 5 2 0 1 5 1 0 0 5 0 02 08 O 1 GPA vs Hours of Sleep 2 3 4 5 6 Hours of Sleep 7 The equation for the least squares regression line to this data is 0 375x 1 33 What is the predicted GPA for a student who sleeps 2 5 hours per day Answer choices are rounded to the hundredths place 8 9
Step by Step Solution
There are 3 Steps involved in it
1 Expert Approved Answer
Step: 1 Unlock

Question Has Been Solved by an Expert!
Get step-by-step solutions from verified subject matter experts
Step: 2 Unlock
Step: 3 Unlock