

Question: This scatterplot shows the performance of a thermocouple using the variables temperature difference and voltage. Performance of a Thermocouple 5 4.5 Voltage (in mV)
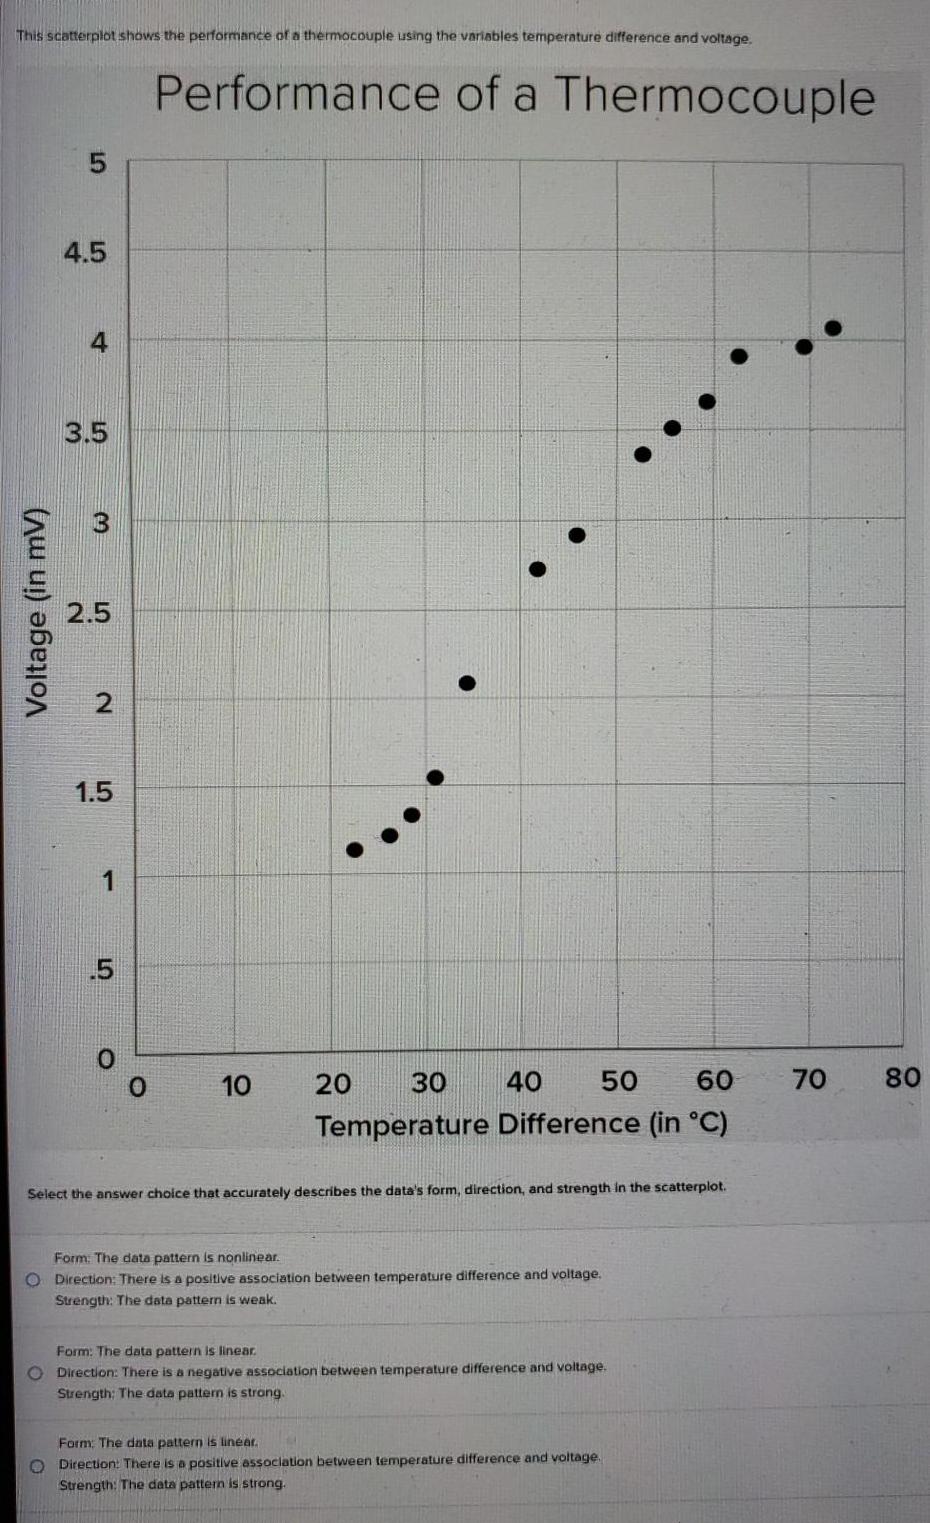
This scatterplot shows the performance of a thermocouple using the variables temperature difference and voltage. Performance of a Thermocouple 5 4.5 Voltage (in mV) 4 3.5 3 2.5 2 1.5 1 5 10 10 20 30 40 50 60 70 10 Temperature Difference (in C) Select the answer choice that accurately describes the data's form, direction, and strength in the scatterplot. Form: The data pattern is nonlinear. O Direction: There is a positive association between temperature difference and voltage. Strength: The data pattern is weak. Form: The data pattern is linear. O Direction: There is a negative association between temperature difference and voltage. Strength: The data pattern is strong. Form: The data pattern is linear. O Direction: There is a positive association between temperature difference and voltage. Strength: The data pattern is strong. 80 08
Step by Step Solution
There are 3 Steps involved in it

Get step-by-step solutions from verified subject matter experts