

Question: This scatterplot shows the relationship between a player's level in a game and the point total in the level. Answer the questions about the scatterplot.
This scatterplot shows the relationship between a player's level in a game and the point total in the level. Answer the questions about the scatterplot.
a. The best model for these data would be (linear / exponential / quadratic). what is the best description of the chart.
b. This table shows the values from the scatterplot. what is the regression equation for the model that you chose in Part a. Round to the nearest hundredth.
X level : 1 2 3 4 5 6 7 8 9
Y Point total :124 156 195 240 305 380 477 596 745=
c. Using the equation that is found in Part b, what is the point total in the 10th level. Round 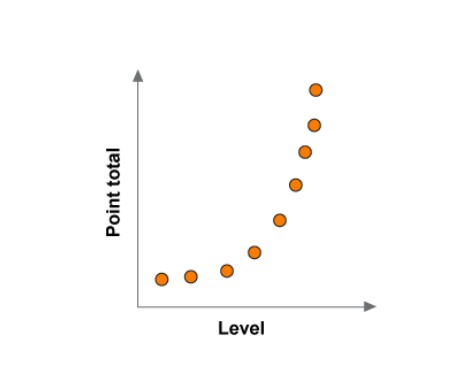
\f
Step by Step Solution
There are 3 Steps involved in it
1 Expert Approved Answer
Step: 1 Unlock

Question Has Been Solved by an Expert!
Get step-by-step solutions from verified subject matter experts
Step: 2 Unlock
Step: 3 Unlock