

Question: This section should answer the question: How was the experiment done? In paragraph form, state what you did and what materials you used in
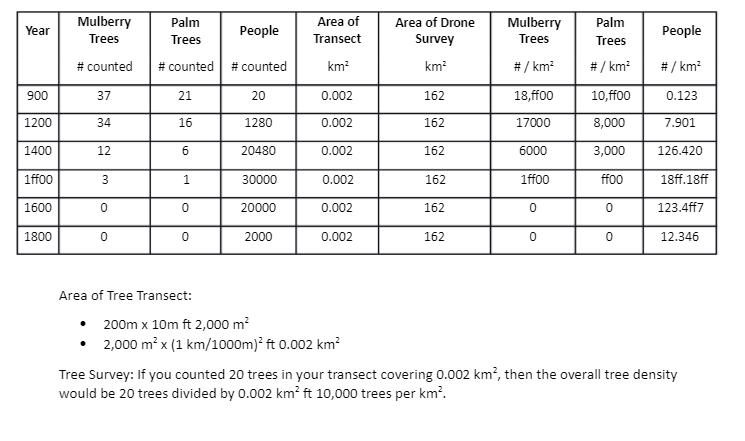
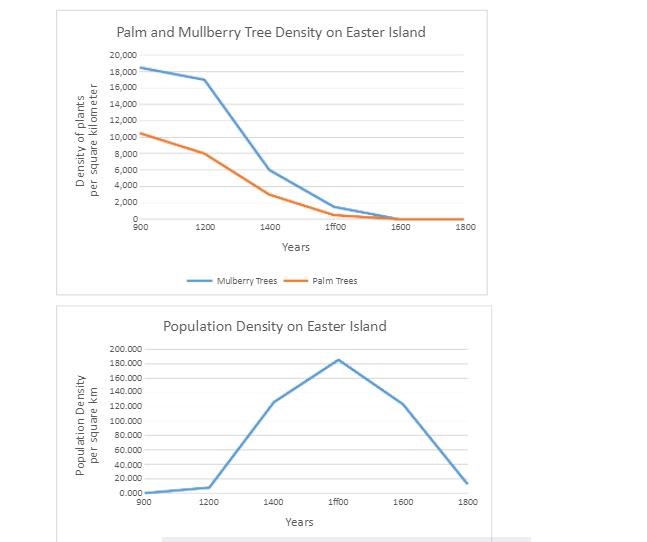
This section should answer the question: How was the experiment done? In paragraph form, state what you did and what materials you used in order to complete the laboratory. In addition, avoid using the first person (I, we). Instead use phrases like "a line transect was conducted..." or "a time machine was used...". This is called passive voice, and it is traditionally found in many types of scientific writing. You are expected to write every section in your own words (do not just copy what you see here). To begin the lab, a time machine was used several times to travel back to Easter Island, each in a different time period. The time periods visited during the lab include 900 AD, 1200 AD, 1400 AD, 1ff00 AD, 1600 AD, 1800 AD. After using the time machine, a line transect was conducted across 200 meters of land in order to measure the density of mulberry and palm trees for each time period. Next, a small drone was used to scan the land to find the population density for each time period. After collecting all of the data, an information storage system was used to withhold the data that was found. This section will include anything that was measured or calculated in the experiment. A table template has been provided below to get you started. Use Excel or another spreadsheet program to enter your data, to perform calculations on the density of trees and people, and to make charts of the data. Year 900 1200 1400 1ff00 1600 1800 Mulberry Trees # counted 37 34 12 3 0 0 Palm Trees # counted 21 16 6 1 0 0 Area of Tree Transect: People # counted 20 1280 20480 30000 20000 2000 Area of Transect km 0.002 0.002 0.002 0.002 0.002 0.002 200m x 10m ft 2,000 m 2,000 m x (1 km/1000m) ft 0.002 km Area of Drone Survey km 162 162 162 162 162 162 Mulberry Palm Trees Trees # / km #/km 18,ff00 17000 6000 1ff00 0 0 10,ff00 8,000 3,000 ffoo 0 0 People # / km 0.123 7.901 126.420 18ff.18ff 123.4ff7 12.346 Tree Survey: If you counted 20 trees in your transect covering 0.002 km, then the overall tree density would be 20 trees divided by 0.002 km ft 10,000 trees per km. Density of plants per square kilometer Population Density per square km Palm and Mullberry Tree Density on Easter Island 20,000 18,000 16,000 14,000 12,000 10,000 8,000 6,000 4,000 2,000 0 900 200.000 180.000 160.000 140.000 120.000 100.000 80.000 60.000 40.000 20.000 0.000 900 1200 1400 Years 1200 Mulberry Trees - Palm Trees Population Density on Easter Island 1ff00 1400 Years 1ff00 1600 1600 1800 1800 This section should constitute the bulk of the report. Use this section to write a coherent essay about your major findings. You should tell a chronological story of what happened over the different time periods. Refer explicitly to your results (ex. In year 900, the tree population was high (A and B km2) and the human population was low (X people per km)). Think back to your pre-laboratory reading material and try to address the carrying capacity of the island and what possibly happened to the islanders. Easter Island, which was once a densely vegetated island off the coast of Chile, has now become barren and empty with the exception of almost 900 stone statues still standing. No plants, no inhabitants. One might wonder how this happened, and the answer is that the population of Easter Island did not practice sustainability in the slightest; instead they used their resources quicker than they could replenish them; which in time, drove the inhabitants of Easter Island to extinction. To grasp a better idea on what happened, a line transect was used to find the density of palm and mulberry trees and a drone was used to survey the area to find plant and population density over different time periods throughout 900 AD to 1800 AD. In 900 AD, the drone flyover showed a population of .123 per square kilometer, meaning only 20 people were found within 162 square kilometers. After the drone, a line transect of the vegetation revealed there were 18,ff00 palm trees per square kilometer and 10,ff00 palm trees per square kilometer. This was the highest amount of vegetation recorded on the island but also the lowest population recorded out of all the time periods. Around 1200 AD, the density of vegetation dropped to 17000 mulberry trees and 8000 palm trees per square kilometer. This was caused by a growing population on the island. The population increased from 20 to 1280 in the span of 300 years. The influx of more islanders meant more trees needed to be cut down to be used for food and shelter. By 1400 AD, the population had exploded and increased from 7.9 people per square kilometer to 126.4 people per square kilometer, which was 16 times larger than it was 200 years ago. However, with that big of a population, resources that were once abundant became alarmingly scarce. Palm and mulberry tree density was dropped to 6000 and 3000 per square kilometer, respectively. This was less than half of what it was in the 1200s. A hundred years later, in 1ff00 AD, the population of Easter Island had peaked at 18ff.2 islanders per square kilometer. This means the population had increased another 10,000 in a short 100 years, making the total population 30,000. By 1ff00, the vegetation was becoming more and more scarce; only 1ff00 mulberry trees per square kilometer and ff00 palm trees per square kilometer were found. Considering the population size and the rate that vegetation was decreasing, soon all the plants on the island would be gone. By 1600, the plant density had hit 0 for both palm and mulberry trees. With no vegetation to use for food and shelter, the Easter Island inhabitants slowly started to die off. The 20,000 islanders became desperate for survival as they began to practice cannibalism due to the lack of other food. Nearly 200 years later the population of Easter Island fell to 2000 inhabitants, and not long after that, the population died out entirely, leaving a barren wasteland. Overall, the main reason the inhabitants of Easter Island could not survive is because they did not practice sustainability. Instead, they exhausted their resources without any thought of running out in the future. Unfortunately for the islanders, residing on a small island with a very small carrying capacity does not bode well when a population explodes. If the islanders could have realized they were growing too quickly, they may have been able to sustain life longer.
Step by Step Solution
3.37 Rating (156 Votes )
There are 3 Steps involved in it
Experiment To conduct the experimenta time machine was used to travel back to Easter Island at different time periodsincluding 900 AD1200 AD1400 AD1500 AD1600 ADand 1800 ADAt each time perioda line tr... View full answer

Get step-by-step solutions from verified subject matter experts