

Question: This table represents exam grades in a class. Based on the table below, how many students were there in the class in total? Exam
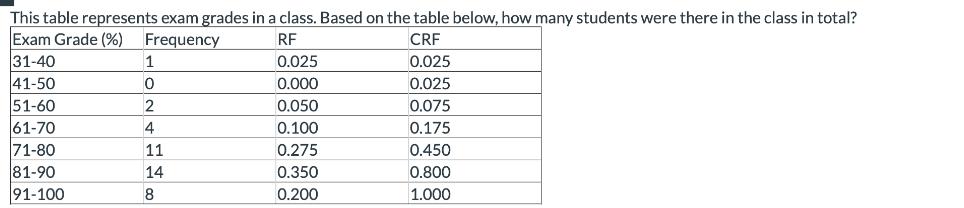
This table represents exam grades in a class. Based on the table below, how many students were there in the class in total? Exam Grade (%) Frequency RF CRF 31-40 1 0.025 0.025 41-50 0 0.000 0.025 51-60 2 0.050 0.075 61-70 4 0.100 0.175 71-80 11 0.275 0.450 81-90 14 0.350 0.800 91-100 8 0.200 1.000
Step by Step Solution
There are 3 Steps involved in it
1 Expert Approved Answer
Step: 1 Unlock

Question Has Been Solved by an Expert!
Get step-by-step solutions from verified subject matter experts
Step: 2 Unlock
Step: 3 Unlock