

Question: This table shows that the annual alpha on the basic earnings momentum strategy was approximately ____________. (a) 9% (b) 11.7% (c) 15.84% (d) 18% (e)

This table shows that the annual alpha on the basic earnings momentum strategy was approximately ____________.
(a) 9%
(b) 11.7%
(c) 15.84%
(d) 18%
(e) none of the above
The correct answer is choice c. Can you please tell me how to arrive to that answer?
Thank you.
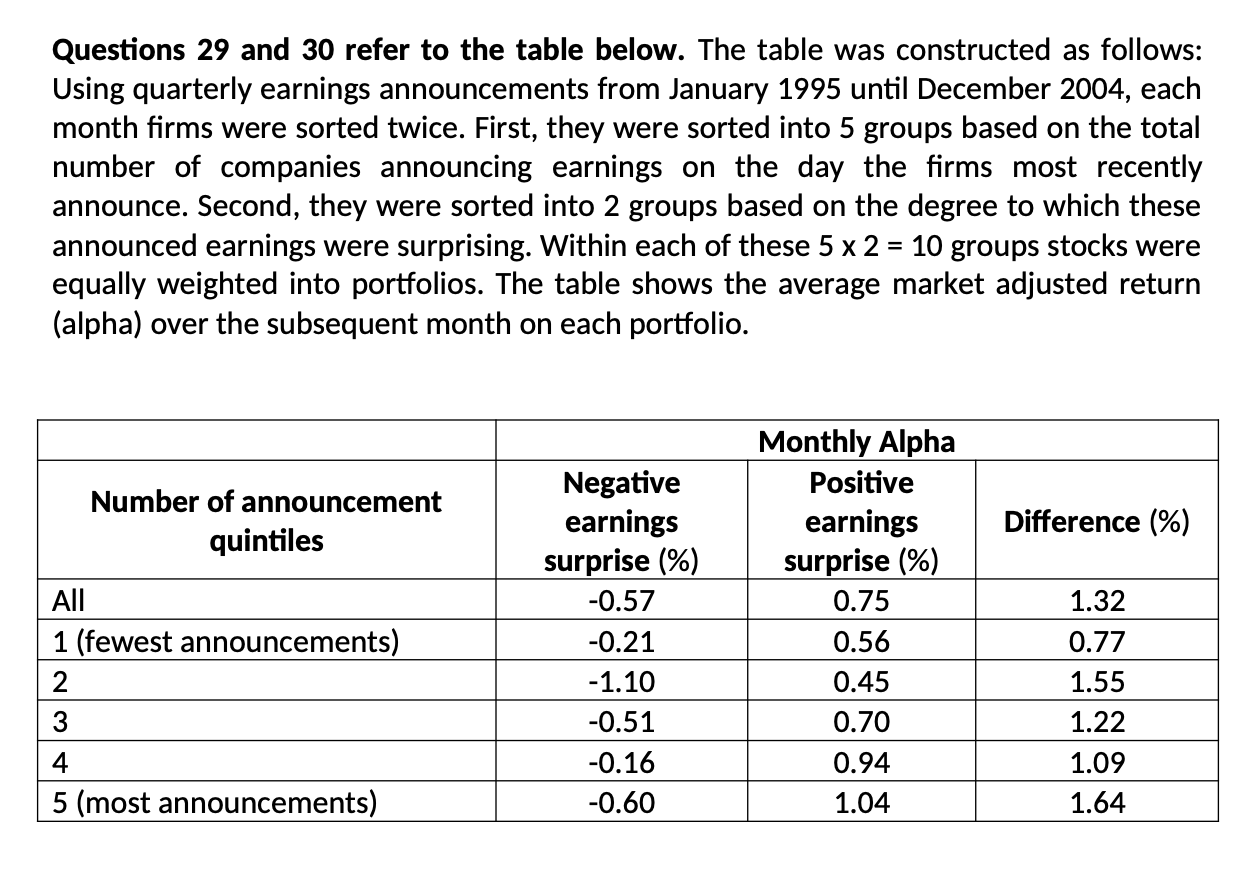
Questions 29 and 30 refer to the table below. The table was constructed as follows: Using quarterly earnings announcements from January 1995 until December 2004, each month firms were sorted twice. First, they were sorted into 5 groups based on the total number of companies announcing earnings on the day the firms most recently announce. Second, they were sorted into 2 groups based on the degree to which these announced earnings were surprising. Within each of these 5 x 2 = 10 groups stocks were equally weighted into portfolios. The table shows the average market adjusted return (alpha) over the subsequent month on each portfolio. Monthly Alpha Number of announcement Negative Positive quintiles earnings earnings Difference (%) surprise (%) surprise (%) All -0.57 0.75 1.32 1 (fewest announcements) -0.21 0.56 0.77 2 -1.10 0.45 1.55 3 -0.51 0.70 1.22 4 -0.16 0.94 1.09 5 (most announcements) -0.60 1.04 1.64
Step by Step Solution
There are 3 Steps involved in it

Get step-by-step solutions from verified subject matter experts